
Posted April 01, 2025
By Ian Culley
One Stock, Three Big Paydays — Here’s How You Do It
Scary headlines strike again!
We all know just how easy it is to get sucked into a negative news cycle — and how quickly the bad vibes can cloud your judgement.
You can either freak out with the unwashed masses as tariffs roll out this week…
Or you can sit back, relax, and respect the charts. I prefer the latter.
Clear signposts dot every single chart flashing on your screen. If you learn how to read them, you’ll put yourself in a position to cut through the clutter and pull steady, regular gains from the market.
Today, we’re going to take a look at one of our favorite longer-term charts to show how you can use the simple concepts of support and resistance to set up successful short-term trades. (Think of resistance as selling pressure and support as buying pressure.)
To demonstrate exactly how support and resistance work in a real-life trading environment, I’ll highlight multiple examples of actual trades recommended at The Trading Desk.
Plus, I’ll reveal a level every trader should have marked on their charts.
The Trades…
You already know our long-term take on Robinhood (HOOD).
While we like HOOD for numerous fundamental reasons, it’s also one of our favorite short-term trading vehicles.
Check out the three Robinhood trades from The Trading Desk in 2024.
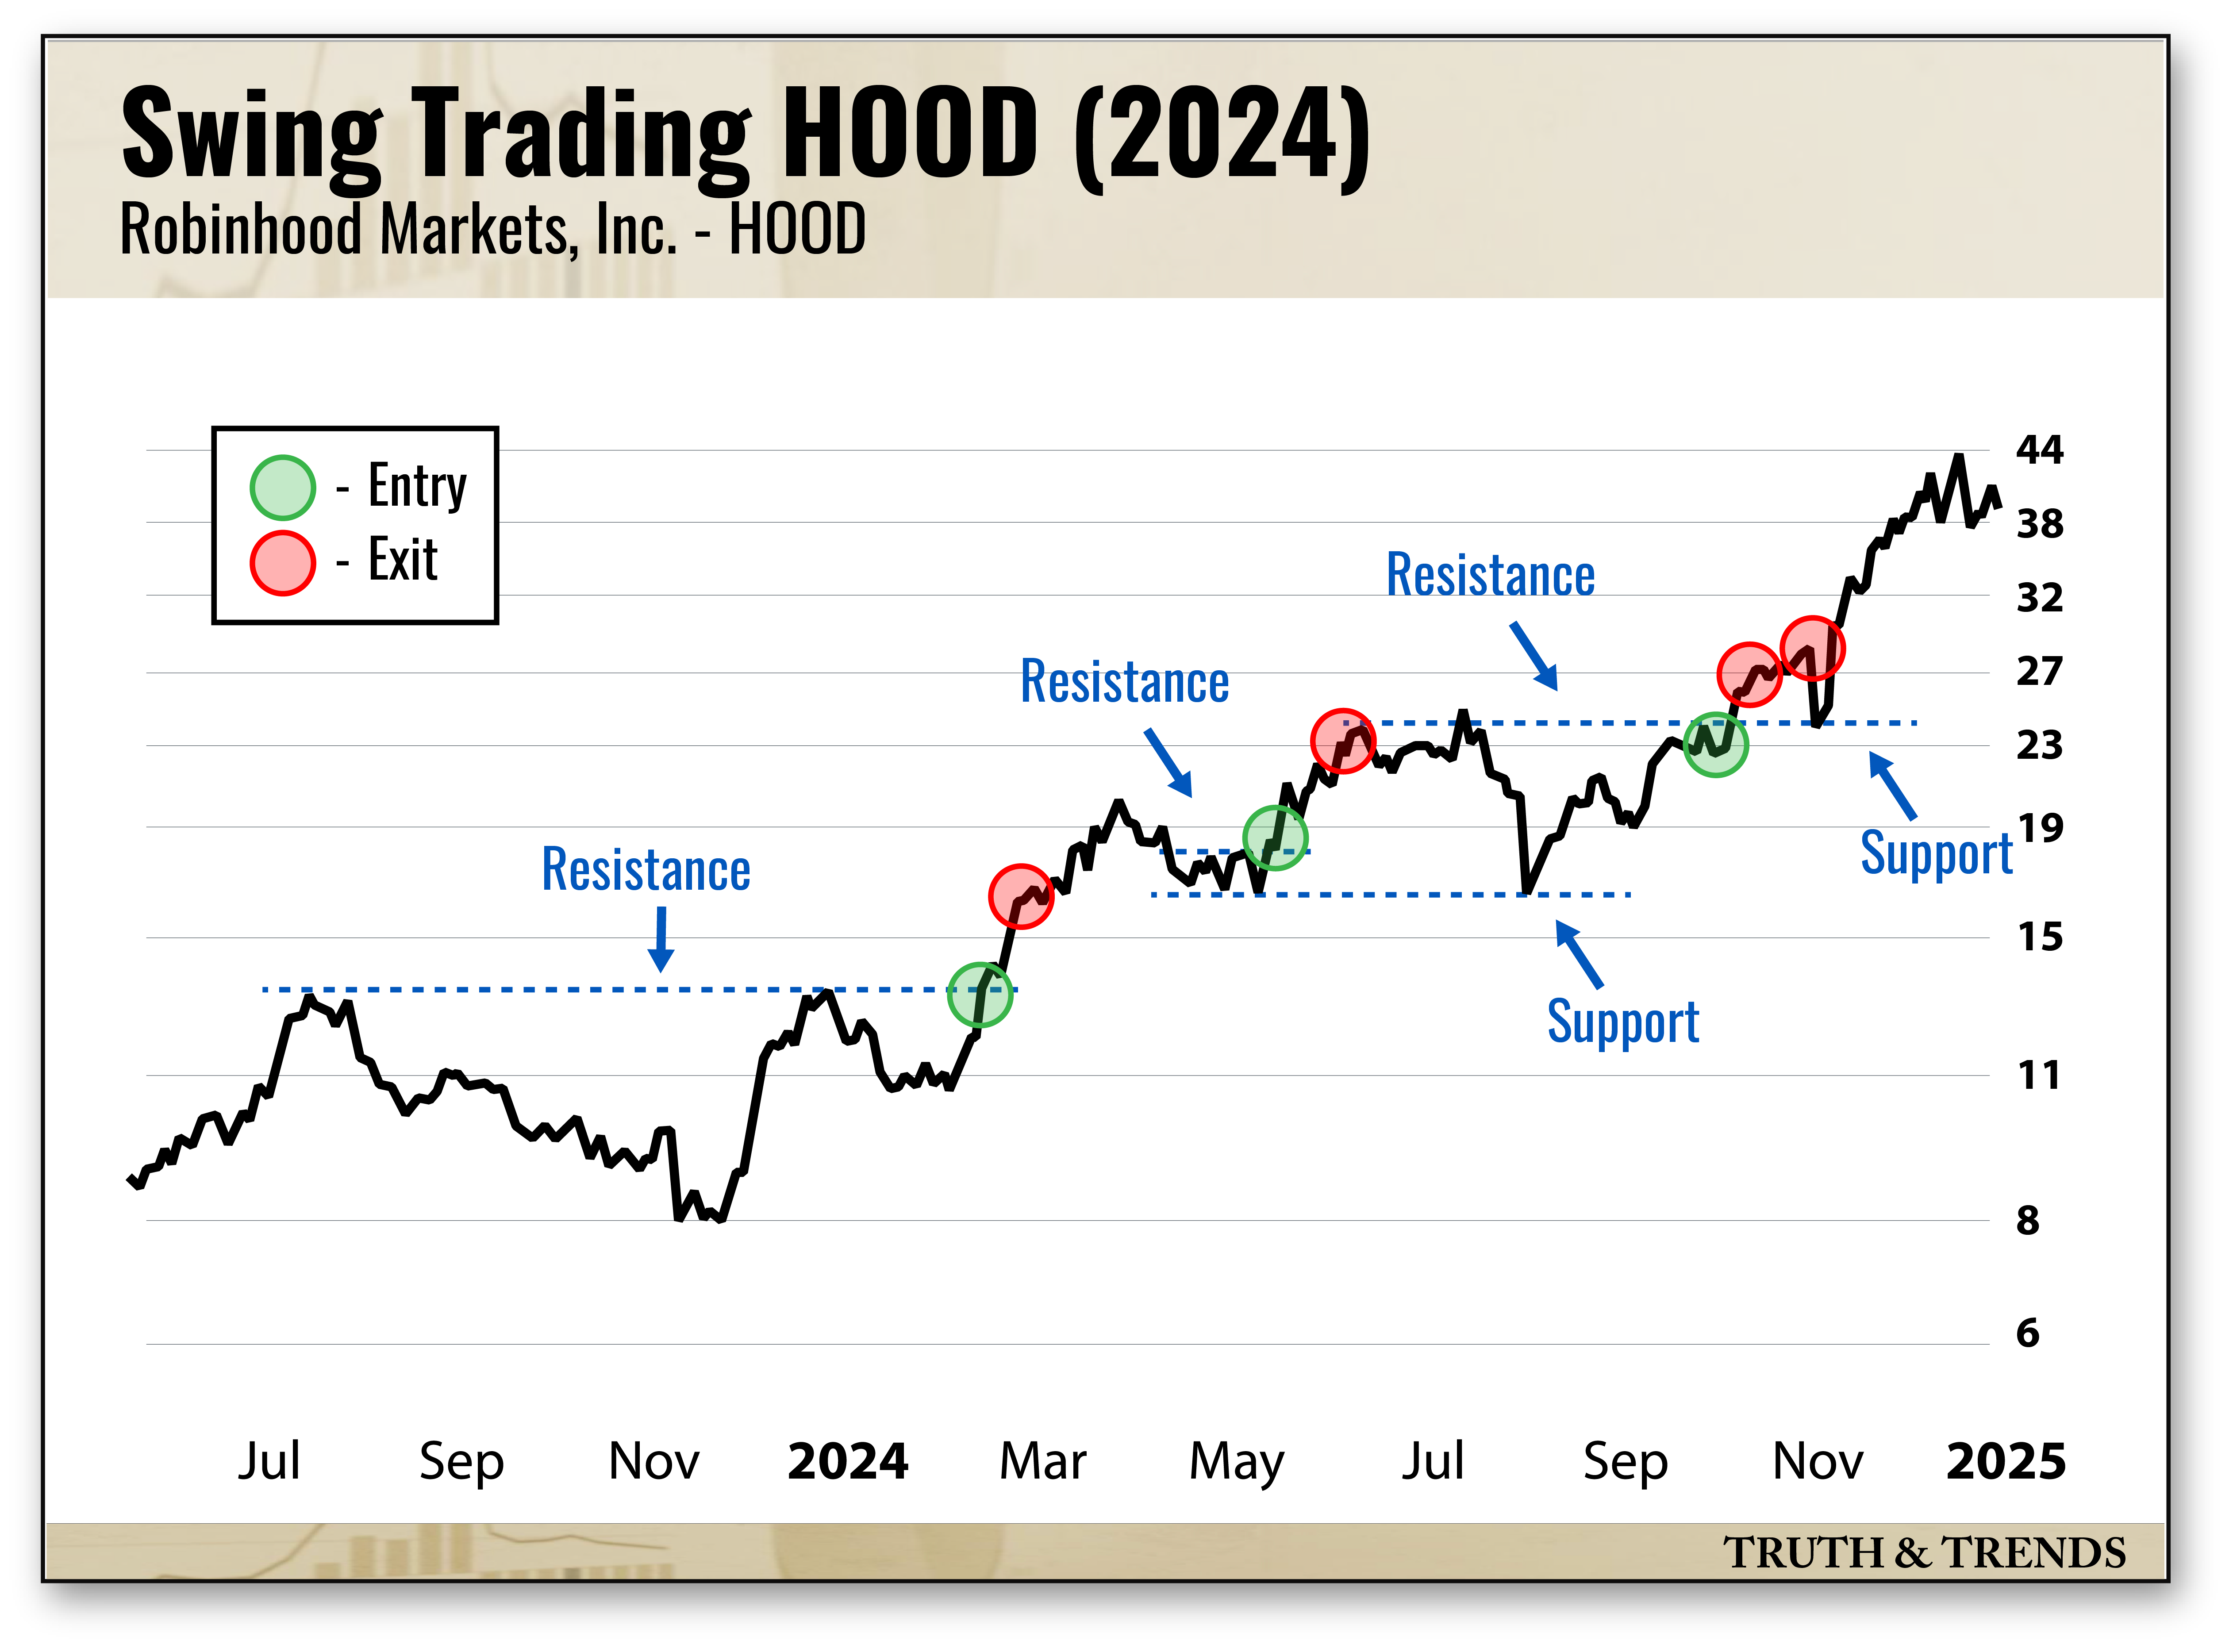
We were able to string together three profitable trading opportunities using HOOD in 2024. As you can see, I’ve marked the entries (green) and exits (red) for each trade, along with notable support and resistance areas (blue dotted lines).
Now, let’s take a closer look at all three trades…
Trade No.1: Navigating a Bitcoin Breakout (Feb. 16-27)
After a slow start to 2024, the averages coasted while Bitcoin marched unceremoniously toward its former all-time highs. And yet a palpable sense of excitement coursed through the markets.
Beneath the surface, names such as Robinhood caught our attention.
November ‘22… July ‘23… December ‘23… Buyers were stopped dead in their tracks every time prices reached $13. They kept coming up against an overwhelming amount of supply (or resistance) as sellers kept a lid on prices following the post-IPO selloff.
For almost two years, that level acted as the ceiling. A $13 handle was their line in the sand, and every investor regularly trading HOOD knew it.
It’s the investor awareness that gave this level significance. Some call this awareness price memory or perhaps market memory. But it doesn’t matter what you call it.
The market was telling us — not once, not twice, but three times — that $13 was an important area we could use to our advantage.
So when HOOD traded just below this key level heading into earnings, we prepared to pounce.
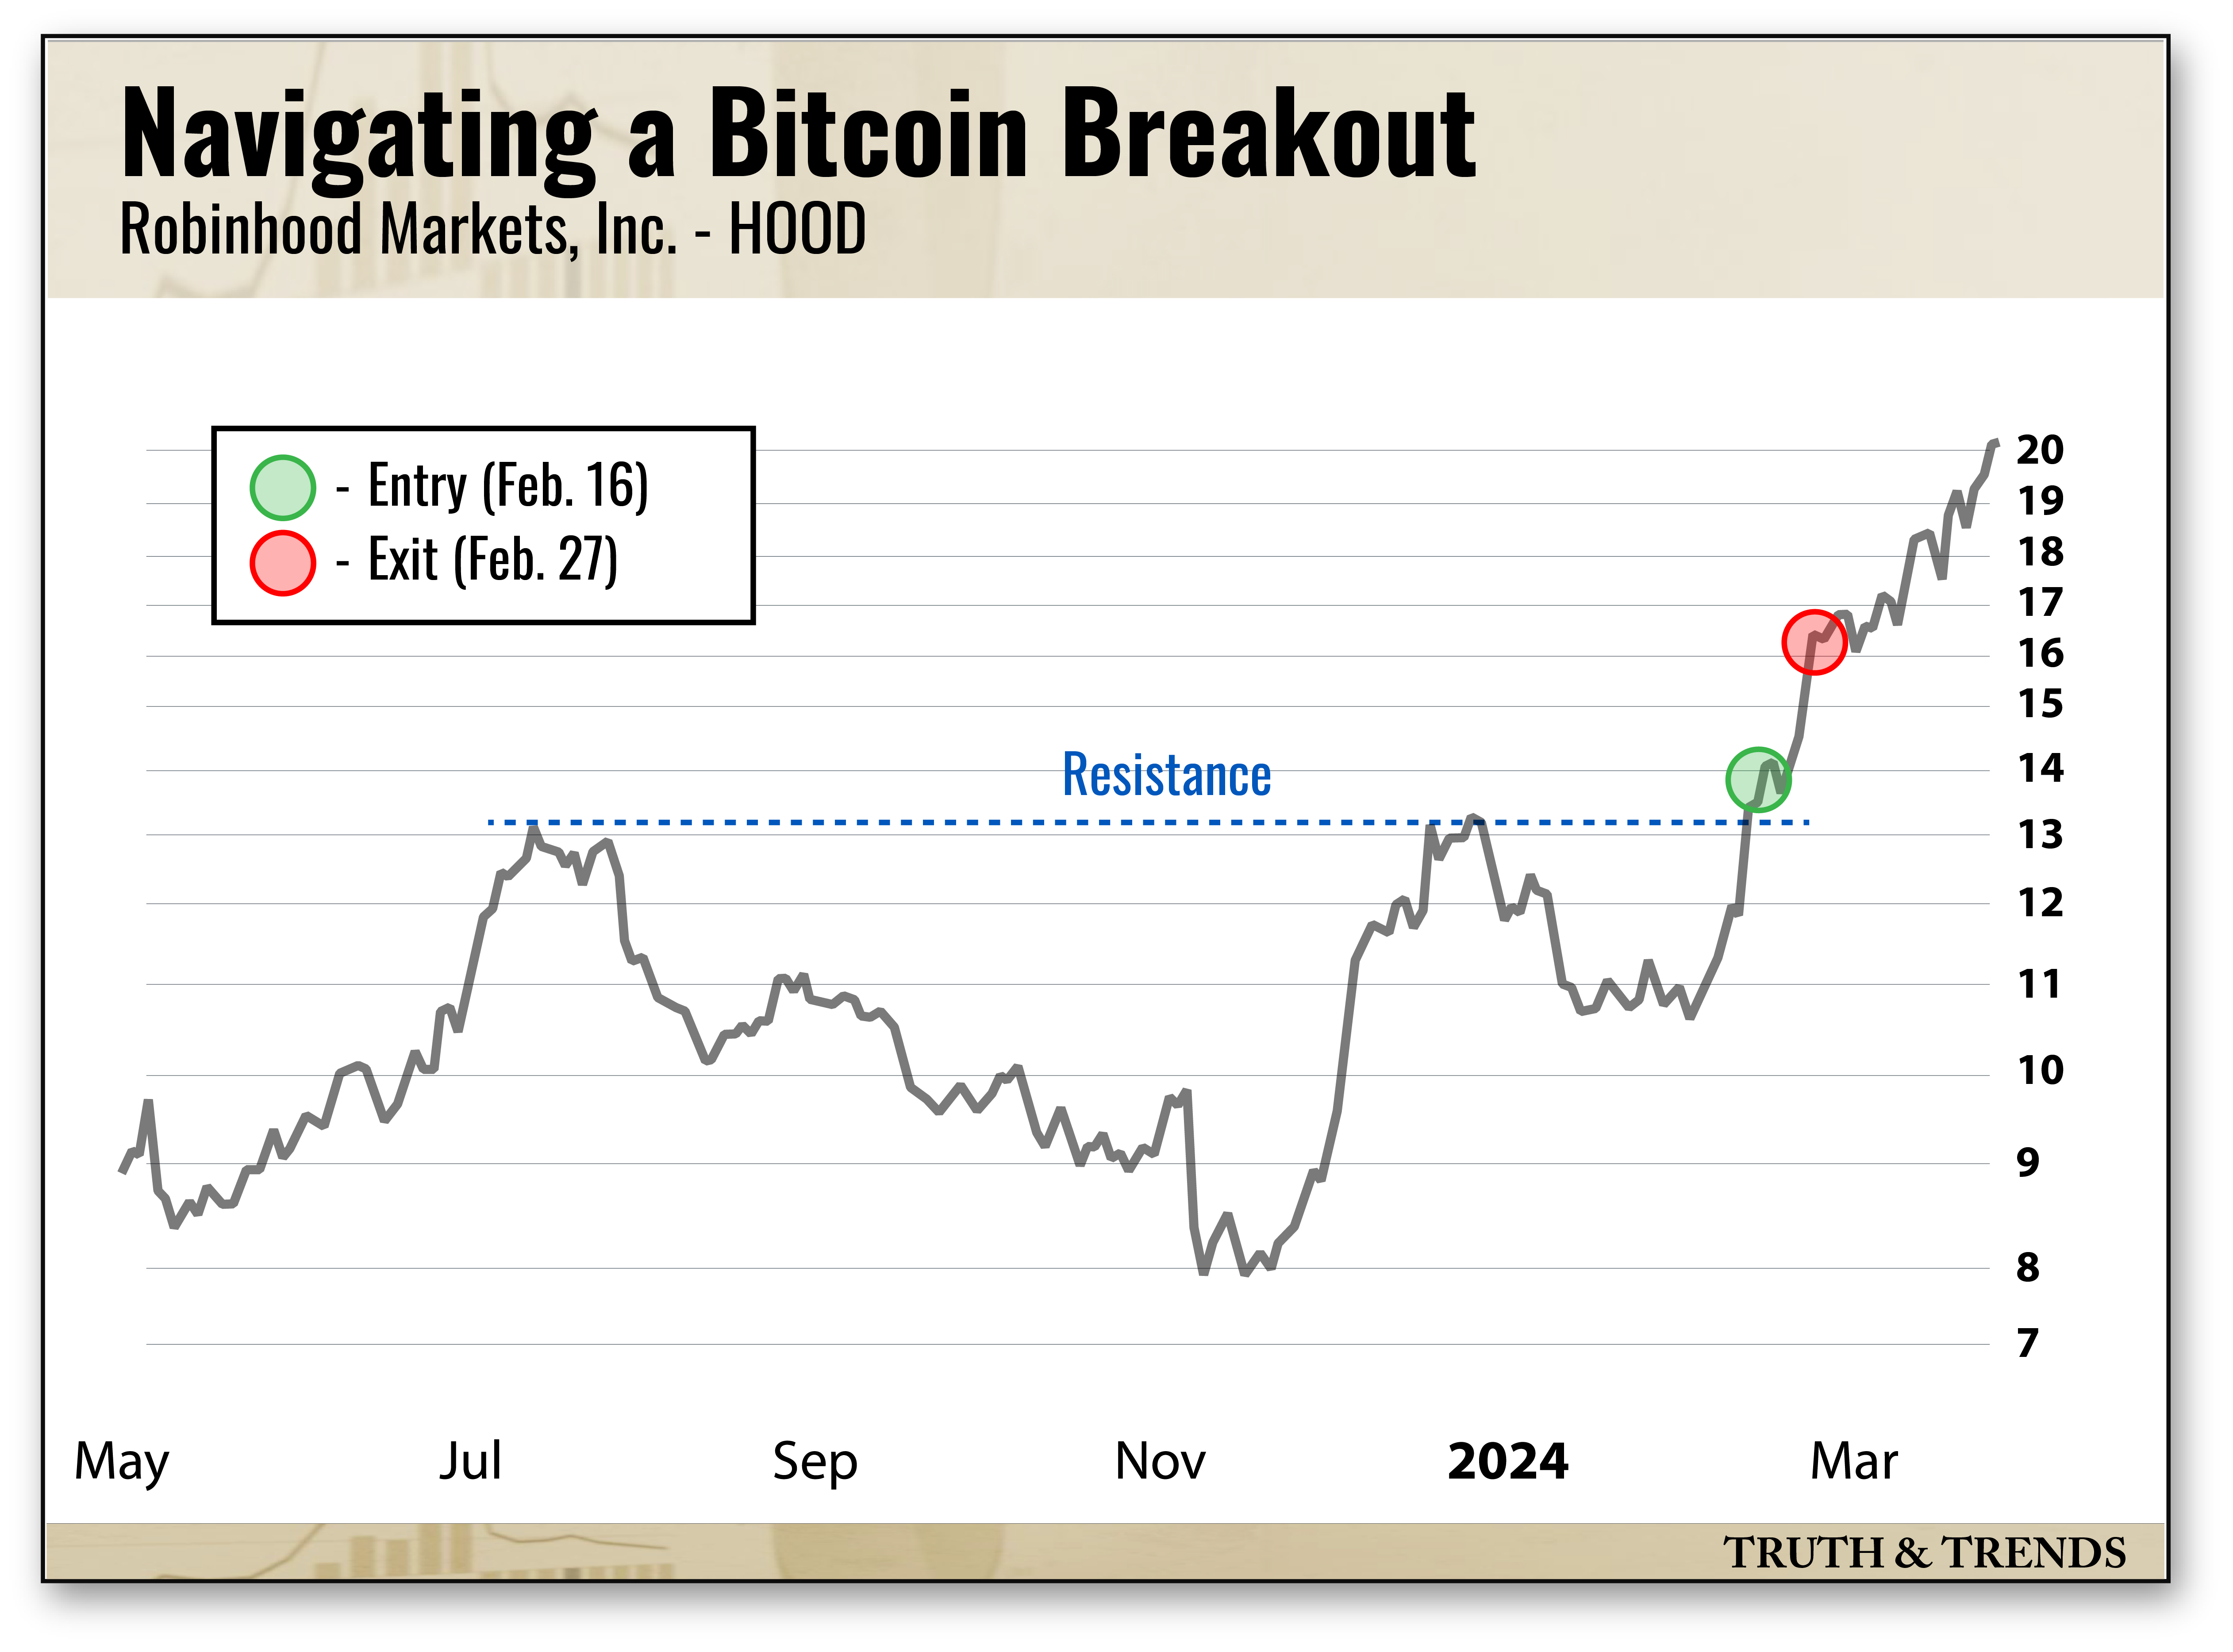
Shares gapped at the February 14 open, taking out that critical resistance level as it recorded its highest daily close since March 2022. Breakout!
Buyers absorbed all of the supply at $13, and risks were now to the upside.
After a brief pause, traders began driving prices higher on February 16. The Trading Desk seized the opportunity, taking a long position in hopes of riding the crypto froth.
Seven sessions later… Bitcoin broke out. Growth blazed higher, and HOOD went vertical.
It was time to book some healthy profits (180.77%, to be exact).
HOOD ran all the way to $20 by late March, but would find its way back to our exit level two months down the road.
Trade No. 2: Catching an Upgrade (May 17- June 6)
Retail traders crawled their way back to the markets later that spring.
Bitcoin's breakout revived the animal spirits, and Robinhood was set to benefit from the renewed interest in markets. Plus, Wall Street took note.
HOOD caught an analyst upgrade on May 17, and the stock began to move.
The Trading Desk stepped up to the plate and took a swing, but the decision had nothing to do with analysts or their upgrades.
Instead, our pitch was Robinhood’s fresh five-week highs, and we belted one out of the park.
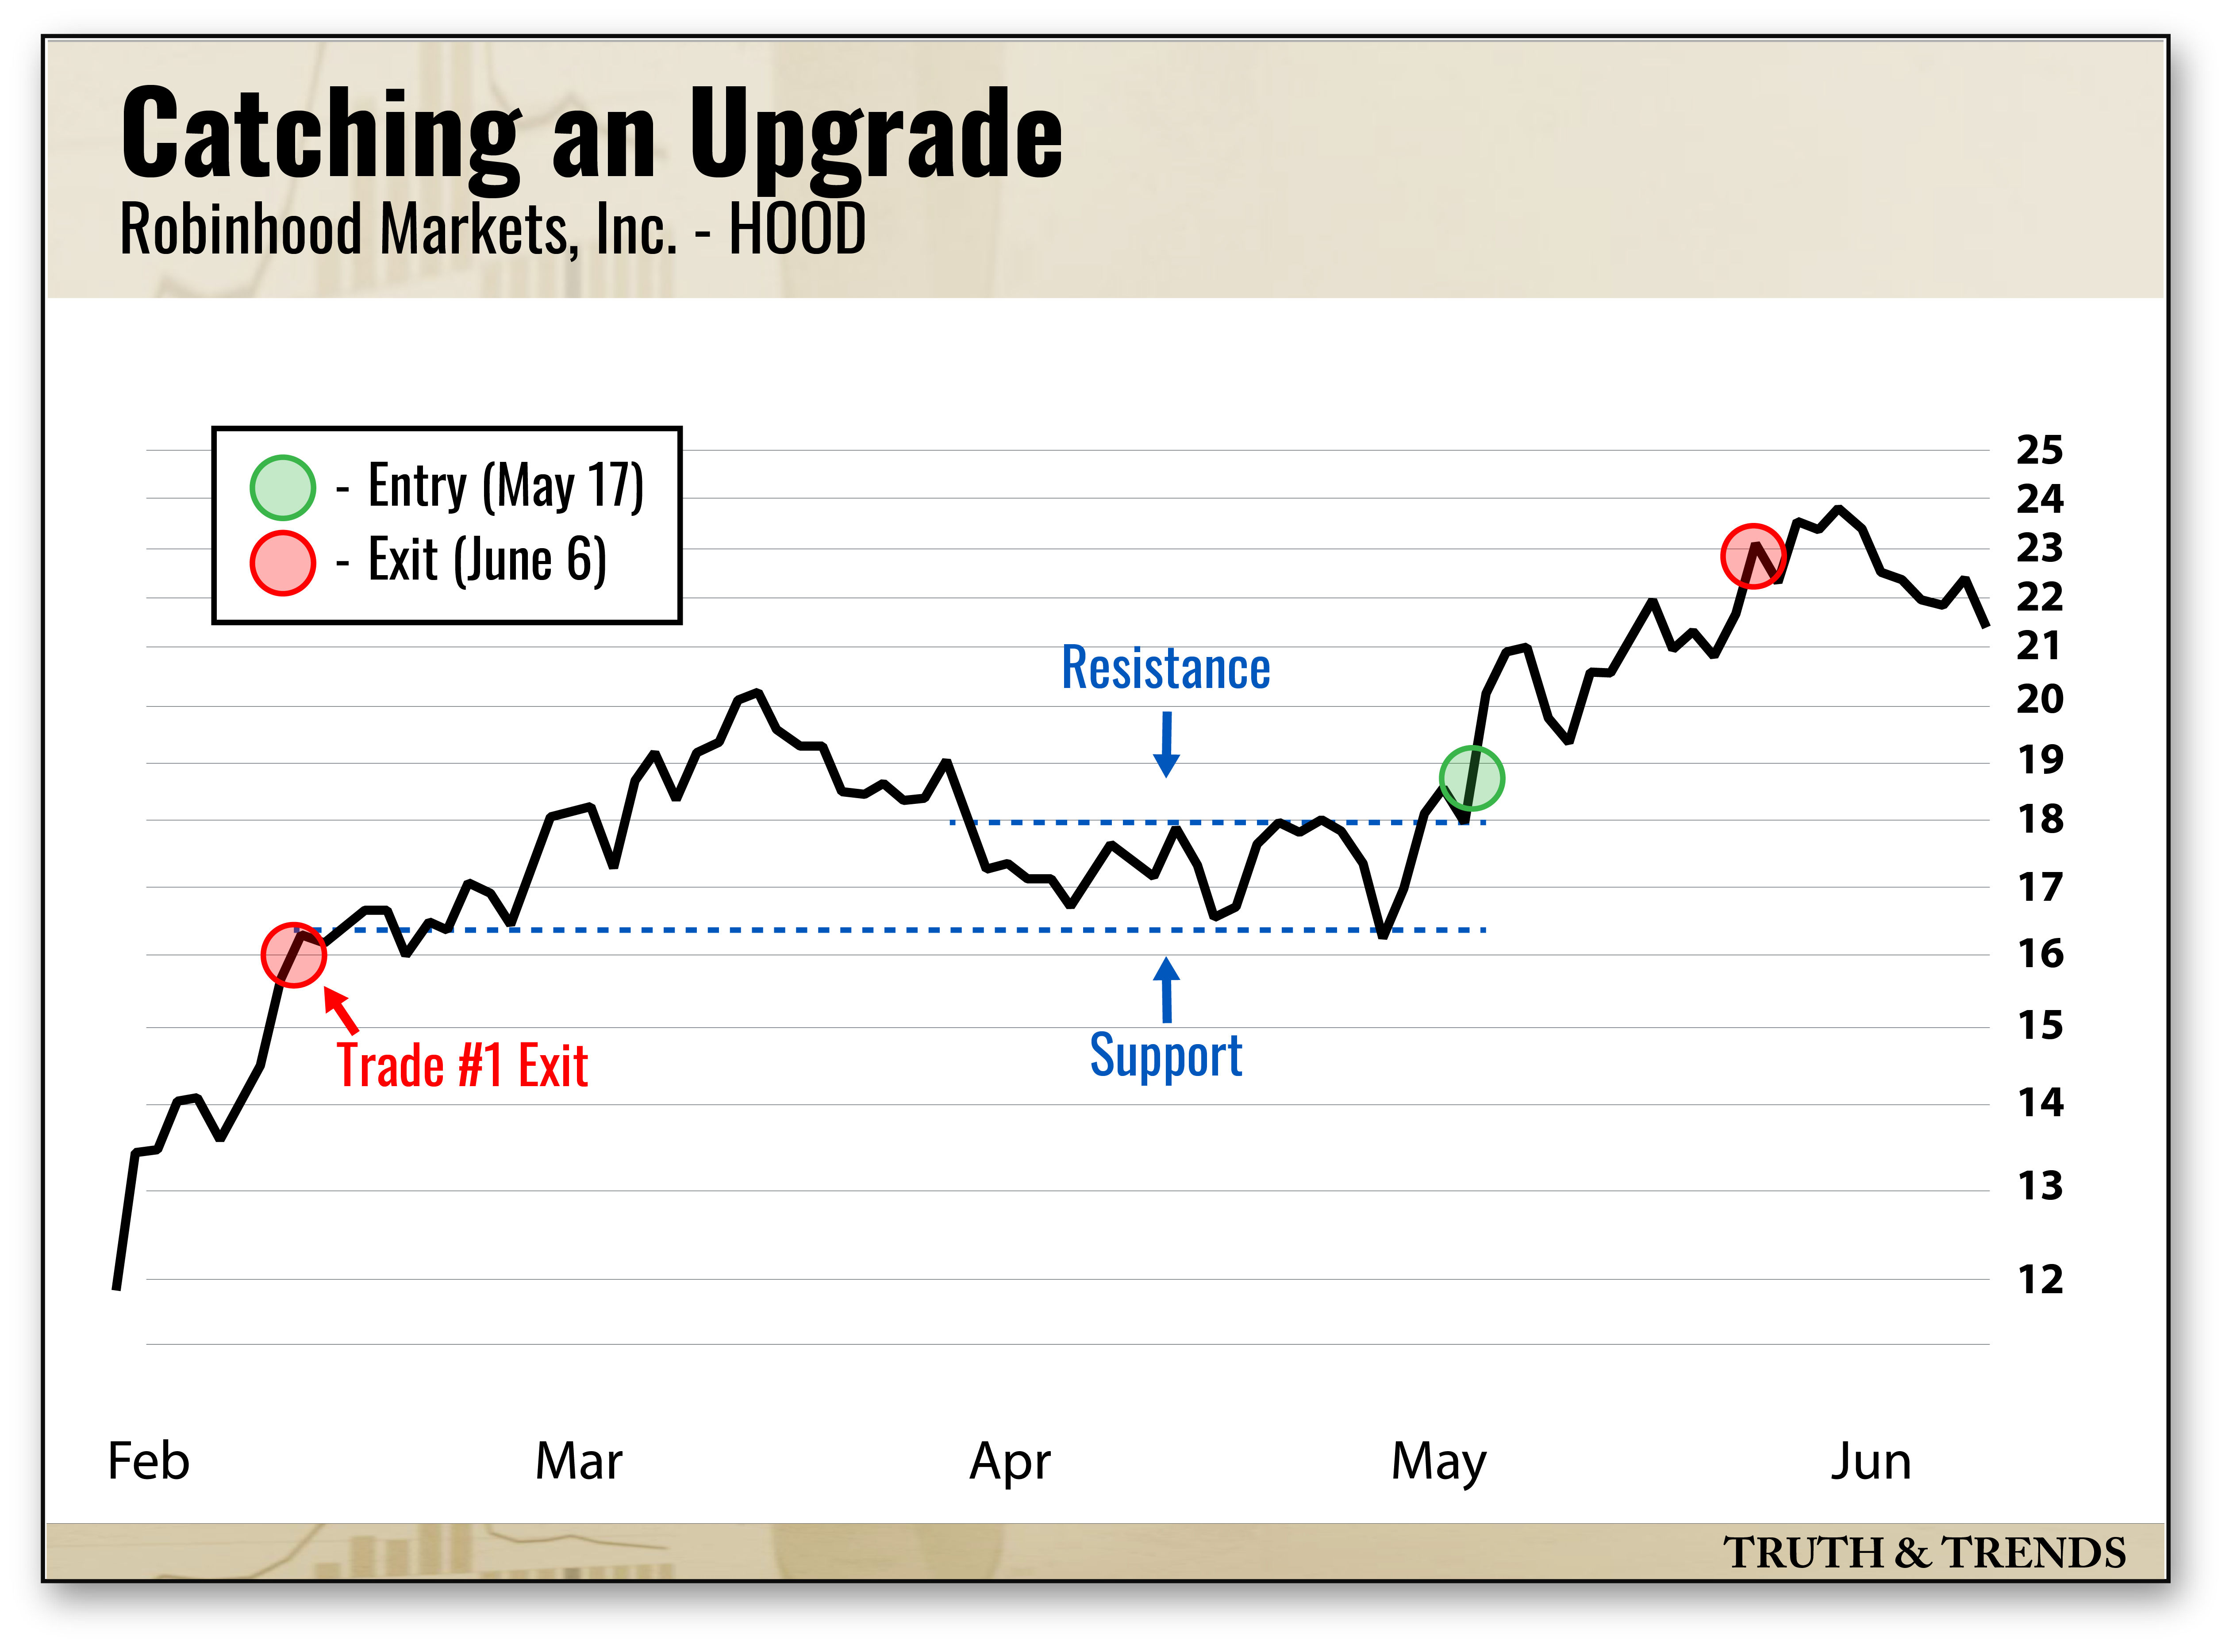
From April 11 to May 16, HOOD traded within a tight range (between $16 and $19).
Every time prices slipped toward $16, investors stepped in and bought. As more shares exchanged hands at this level, the more important it became to investors. This buying pressure created a potential support level.
Many traders bought the lows out of FOMO, wishing they had scooped up shares the last time prices were at these levels in February.
Remember, the retail trade was back in full effect as rumblings of Bitcoin $100K grew. But they weren’t alone.
Seasoned professionals were hitting the buy button by the third retest in May, and the stock began to rip.
Sellers, on the other hand, smashed the bid whenever HOOD reached $18-$19, forming a near-term resistance level.
Since the market respected those former highs, so did we.
The Trading Desk waited for a breakout above $19 to confirm HOOD’s next leg higher and captured a 122.97% profit within three weeks.
Trade No. 3: Playing a Hot Hand (Oct. 7-30)
Crypto and the speculative growth trades were heating up ahead of the presidential election.
We decided to take another swing since Robinhood was challenging a shelf of former highs that had acted as resistance for months and wasn’t due to report earnings until the end of October.
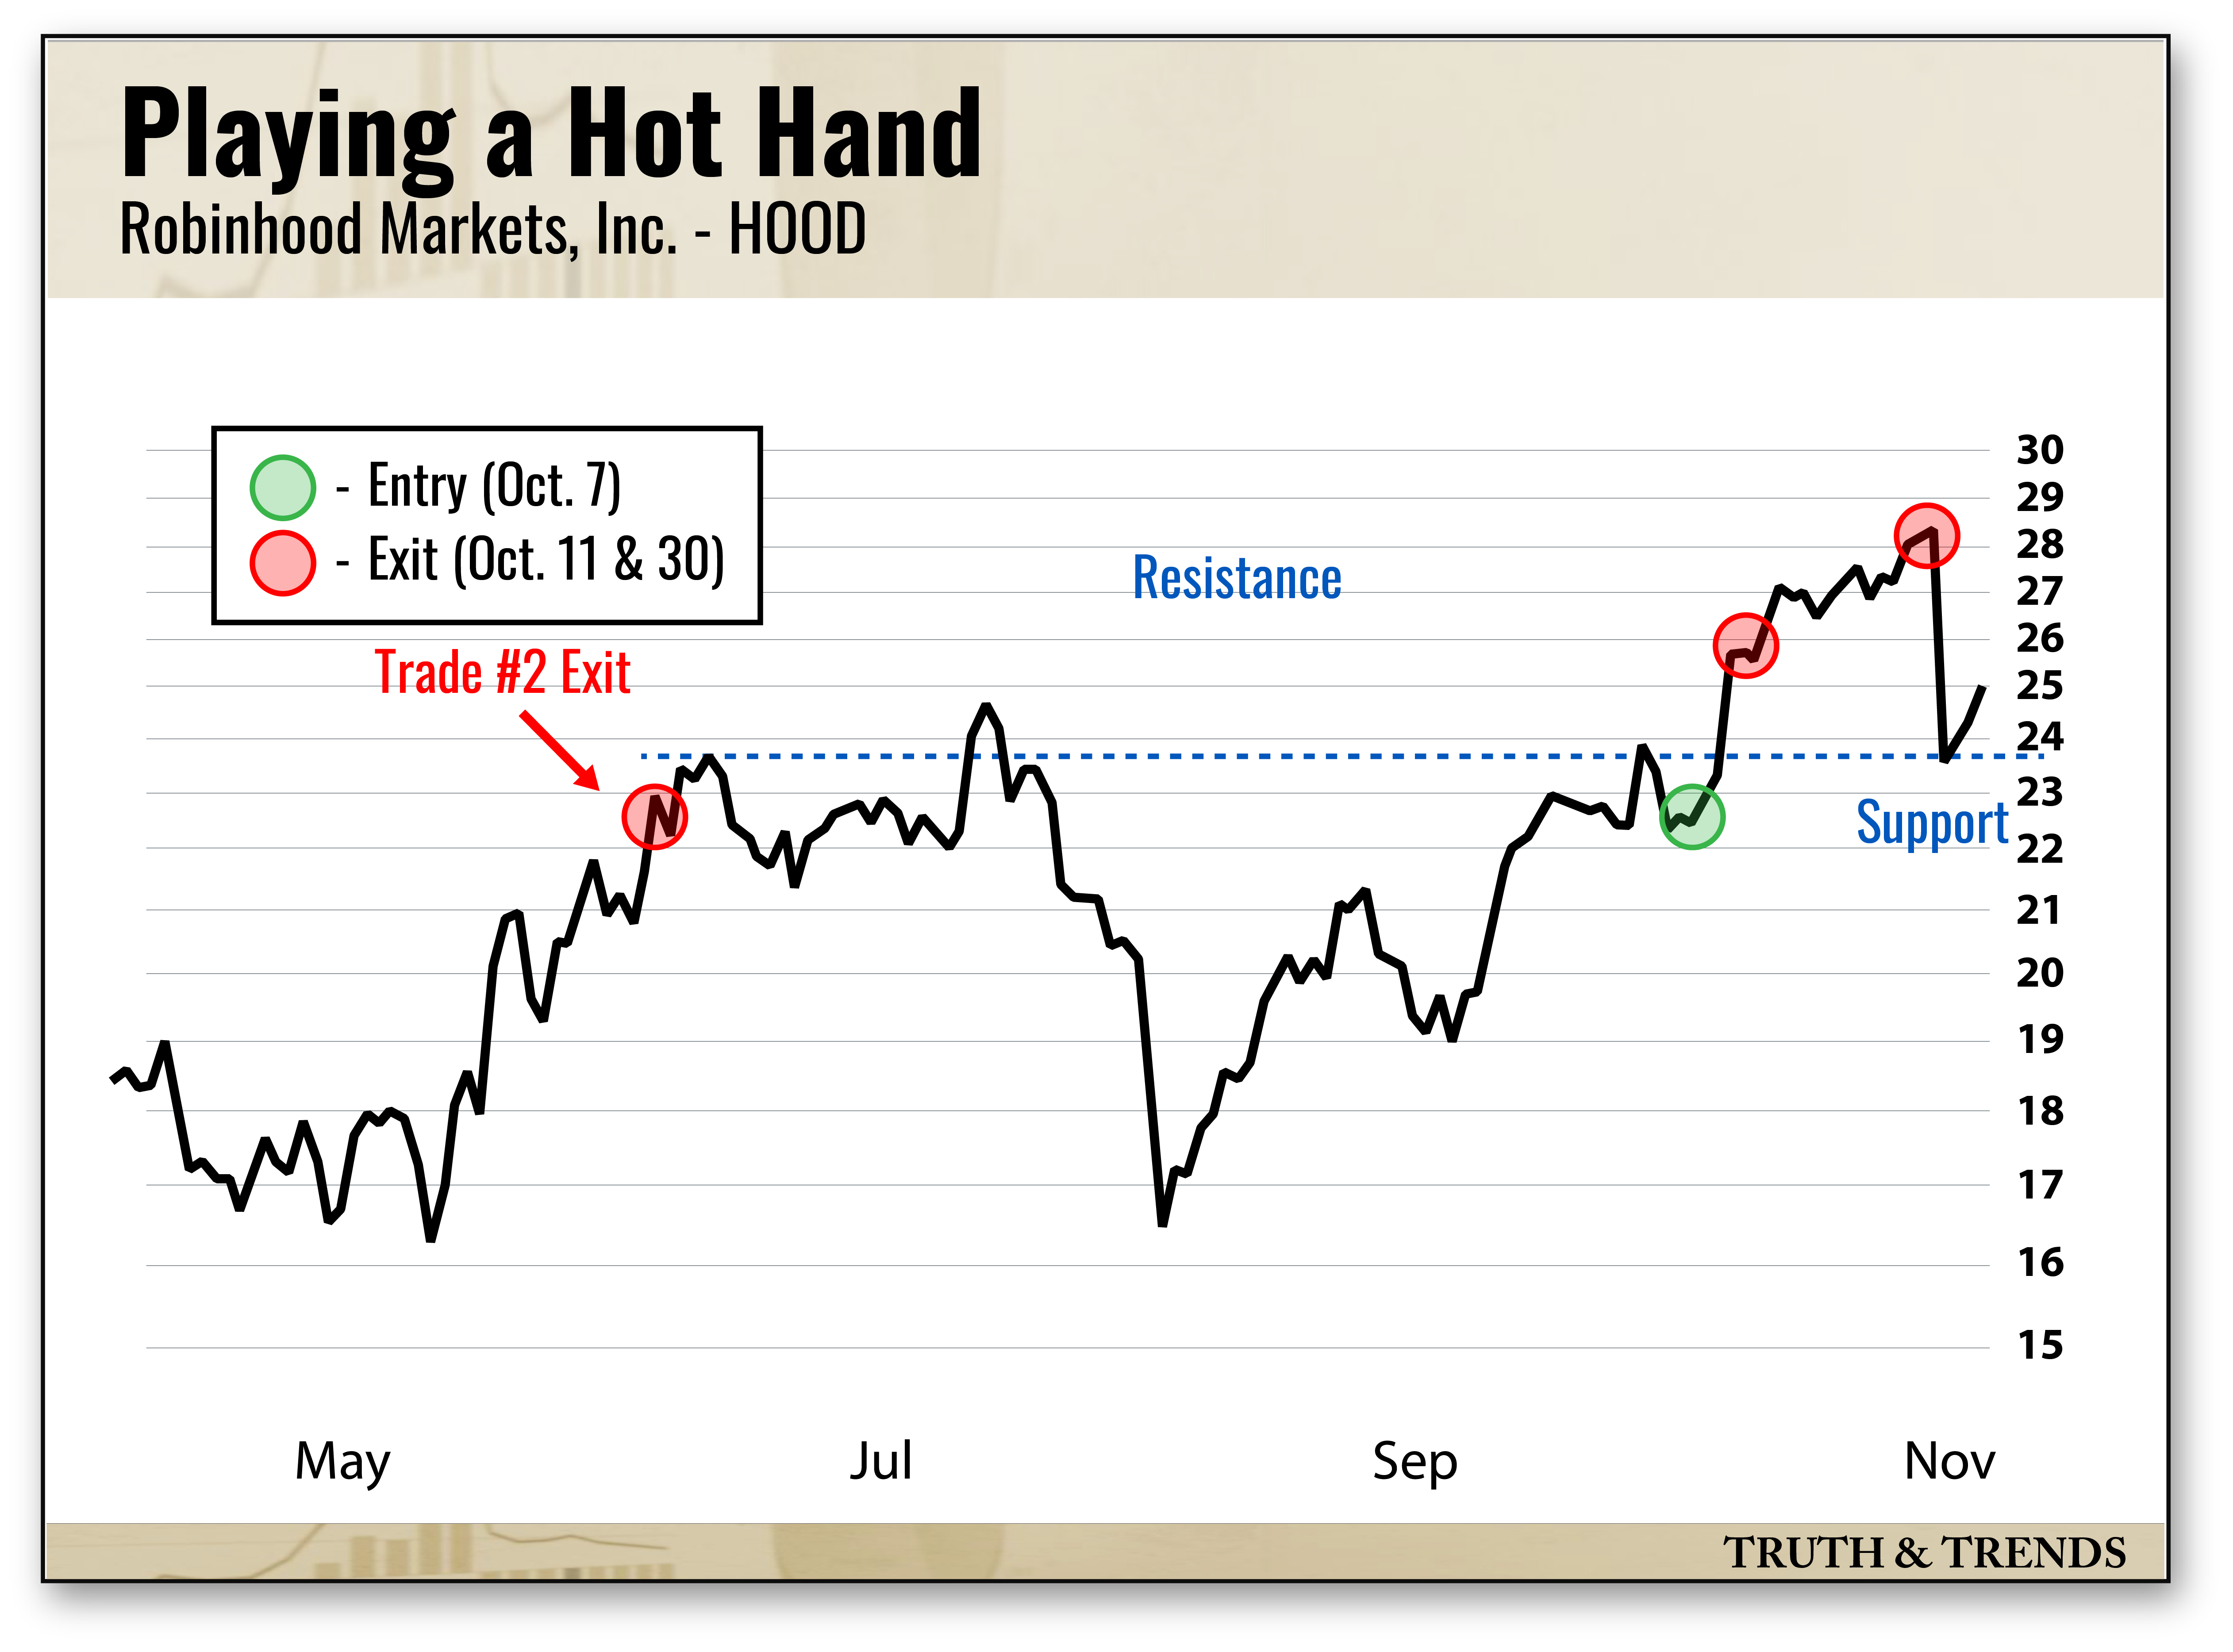
The Trading Desk entered the trade Monday morning following a near-term bounce.
HOOD ripped once buyers absorbed all of the supply at those former highs, and we took half off the table for a 109% gain by the end of the week.
We closed the remaining half a few weeks later for an additional 175% profit.
Mark This Level on Your Charts
Robinhood is forming another critical level after peaking above $40 late last year.
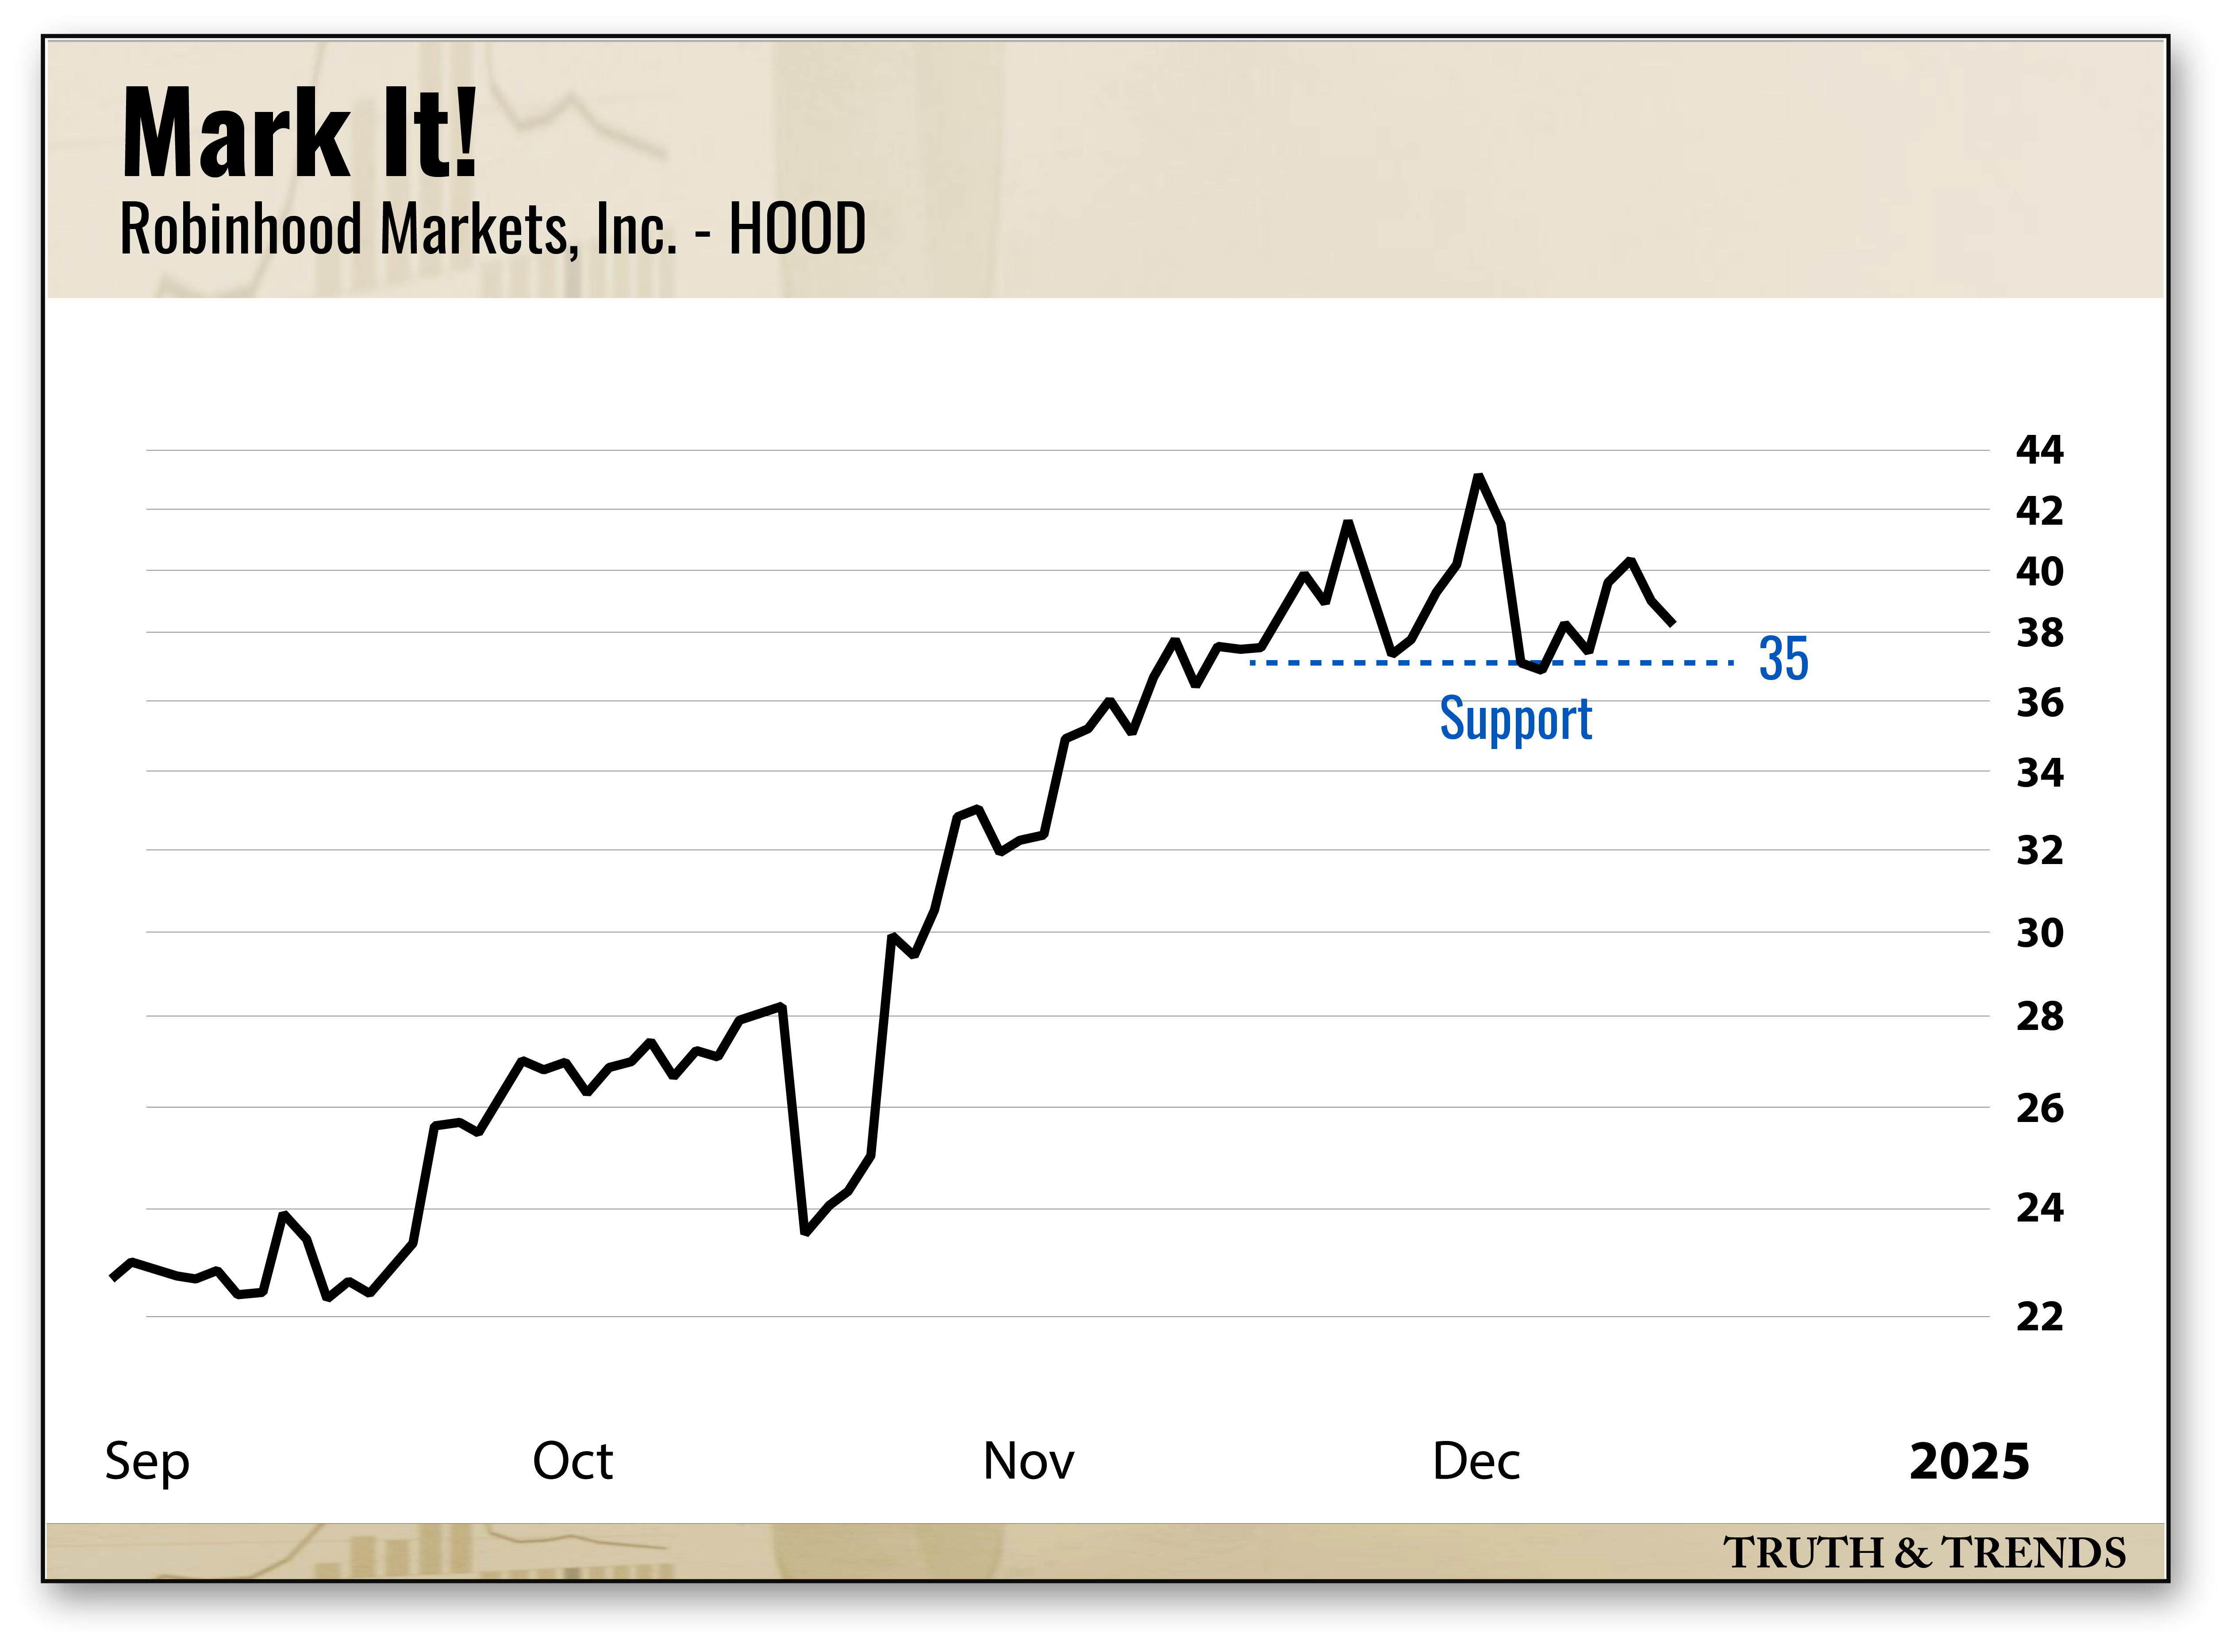
Every time HOOD slips toward $35, buyers show up on cue to support higher prices.
The market is providing us with a clear signpost: You don’t want to be holding HOOD on the other side of $35.
Of course, you can track the trade war news and the Liberation Day madness, but all you need are the charts and a clear understanding of support and resistance.
Sign Up Today for Free!
Truth & Trends brings you market insights and trading tips you won't find anywhere else — unless you have your own personal hedge fund manager on speed dial...
Meet Enrique Abeyta, one of Wall Street’s most successful hedge fund managers. With years of experience managing billions of dollars and navigating the highs and lows of the financial markets, Enrique delivers unparalleled market insights straight to your inbox.
In Truth & Trends, Enrique shares his personal take on what’s moving the markets, revealing strategies that made him a star in the world of high finance. Whether it’s uncovering the next big trend or breaking down the hottest stocks and sectors, Enrique’s insights are sharp, actionable, and proven to work in any market condition.
Inside these daily updates, you’ll gain:
- 50 years of combined trading wisdom distilled into actionable insights.
- A behind-the-scenes look at how Wall Street pros spot opportunities and avoid pitfalls.
- Exclusive strategies that Enrique personally uses to deliver exceptional returns — no fluff, just results.
To have Truth & Trends sent directly to your inbox every weekday, just enter your email address below to join this exclusive community of informed traders.
Don’t miss your chance to learn from one of the best in the business.
Sign up now and take your trading game to the next level.

“Luck Is Not Real”
Posted February 19, 2026
By Enrique Abeyta
The S&P 500 Lies
Posted February 18, 2026
By Nick Riso

The Kill Switch: How a Hidden Algorithm Is Blowing Up Boring Stocks
Posted February 16, 2026
By Enrique Abeyta

Snapback Trade Watchlist: HOOD, SHOP, TOST
Posted February 13, 2026
By Greg Guenthner

Play Ball! 3 Investing Rules From the Baseball Diamond
Posted February 12, 2026
By Enrique Abeyta

