Posted December 23, 2024

By Enrique Abeyta
I'm Buying Stocks Hand Over Fist
After last week's brutal selloff, most investors are probably hoping for a quieter week ahead. But here's the thing…
What we saw in the stock market last week after the Fed meeting might just be the best Christmas gift investors could have asked for.
I know, I know. It’s not exactly fun to watch the stock market take a plunge like that.
But this exact setup — a sharp December drop right after new market highs — has created some of the most profitable opportunities I’ve seen.
In fact, I'm so confident about what's coming that I'll even share a way you could potentially make 4X the broad market's returns as stocks snap back.
But first, I want to show you why this is one of the highest-probability setups I've seen all year.
We're talking about a rare combination of technical signals, seasonal patterns, and institutional forces all pointing to the same outcome.
Allow me to explain...
You Should Be Buying Stocks Right Now!
The combination of the broad weakness before the selloff and the strength of the selloff put the stock market in a rare oversold position.
My favorite technical indicator to determine whether something is overbought or oversold is the relative strength index (or RSI).
This is an indicator that measures how fast a stock has moved, which can tell you how emotional investors are at the moment.
An RSI of above 70 indicates that a stock is overbought and investors are exuberant. This can be a good sign that stocks are likely to correct.
An RSI of below 30 indicates that a stock is oversold and investors are panicked. This is a great indicator of a time when you should be buying a stock.
Or as Warren Buffett famously said, investors should be “fearful when others are greedy, and greedy when others are fearful.”
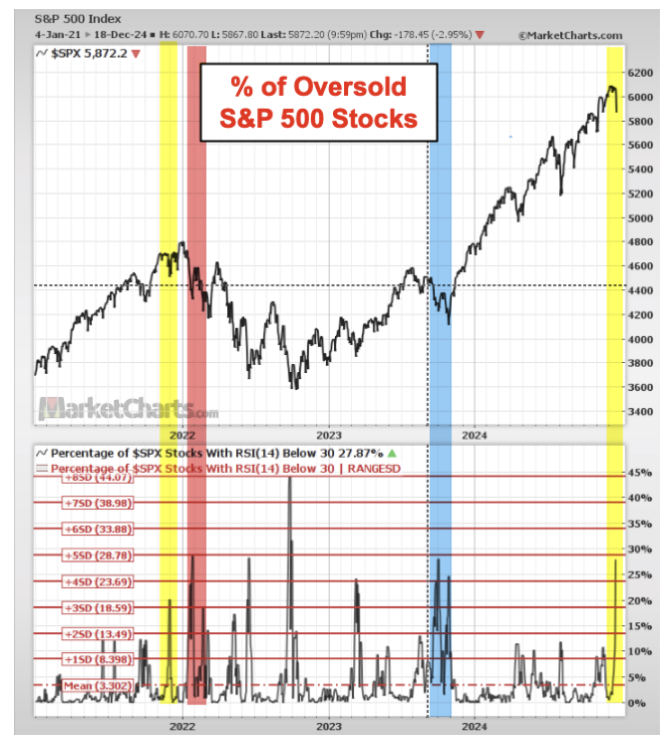
This table from my friend Frank Cappelleri shows the percentage of stocks in the S&P 500 trading below the 30 level.
Source: MarketCharts
In the chart, you can see that nearly 30% of stocks are trading below this critical level.
The areas that Frank highlighted in the chart are when we have seen these levels coming off a recent all-time high in the S&P 500.
As you may recall, the S&P 500 saw a new high just a few weeks ago on December 6.
The section in blue was when this happened in early 2024, another awesome buying opportunity.
The areas in yellow and red were when this happened in late 2021 and early 2022, right before the stock market entered a steep correction.
Look closely at the chart, and you’ll notice something interesting. In both of those instances, the S&P 500 still traded higher in the next few weeks, up 6% in both cases.
This means that when we get to these levels of oversold — even if we are about to enter a new bear market — stocks are likely to trade higher in the near term.
In other words, buying stocks right now could be a VERY good bet!
Let’s also not forget the impact of seasonality on stock prices. Many investors think it’s voodoo, but these are powerful market forces.
The most powerful time for seasonality is right now, at year-end, when many professional investors are highly motivated to push the stock market higher.
Here are a couple more great charts from Ryan Detrick of Carson Investment Research that demonstrate this in action.
The first shows the month-to-date returns for the S&P 500 every day in December.
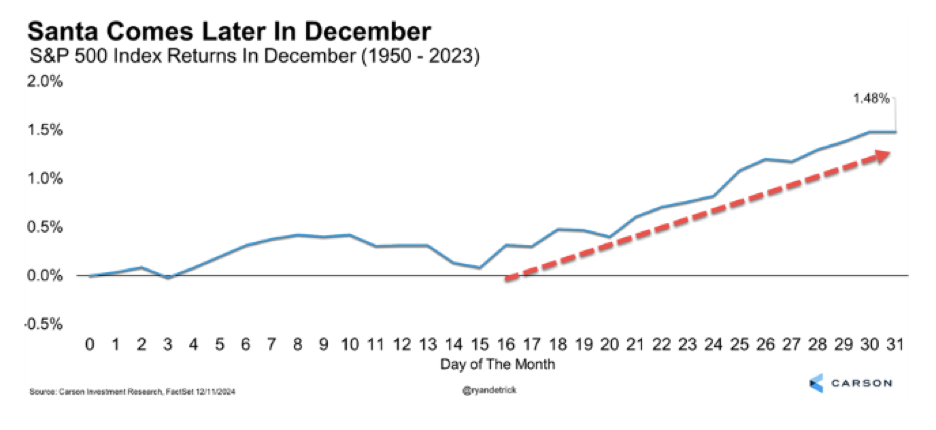
Source: Carson Investment Research
Notice something about the dates?
Usually the S&P 500 bottoms on December 15 and then rallies the rest of the month. The big selloff happened on December 18, almost right on time.
Earlier this month, I mentioned how when the stock market (and thereby most managers) are up big on the year, they are more likely to buy stocks when they are down.
Here’s another great table showing how the S&P 500 has done in December when it was up at least 20% year-to-date heading into the month.
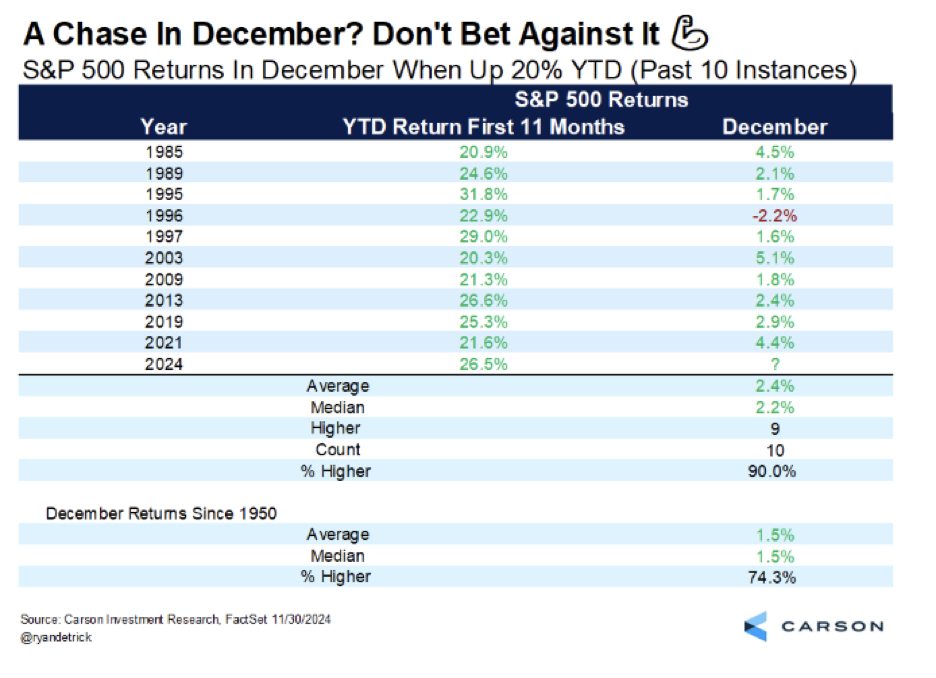
Source: Carson Investment Research
Over the last four decades, it has gone up every time except one. Even then, it was only down 2.2% for the month.
I am always looking for high-probability bets in the stock market, and think the current setup is a very attractive one.
It’s a rare oversold market combined with the strongest seasonality of the year.
Now Is the Time for a Big Bet
After last week’s selloff, I’ve been recommending stocks hand-over-first in my trading service The Maverick to take advantage of this opportunity.
If you want to make a high-probability bet heading into year-end, you can use a leveraged vehicle called an “exchanged traded note” (or ETN).
One worthy of your consideration is the MAX S&P 500 4X Leveraged ETN (SPYU), which tracks the total return of the S&P 500 on a daily compounded leveraged basis.
Put simply, it means if the S&P 500 goes up 1%, this ETN should go up roughly 4%. Naturally, the inverse is also true.
If the broad market snaps back as it’s historically done in this kind of environment, SPYU could help you quadruple the S&P’s gain along the way.
Bottom line, this selloff is an awesome holiday gift for investors — and I hope you take advantage of it!
Sign Up Today for Free!
Truth & Trends brings you market insights and trading tips you won't find anywhere else — unless you have your own personal hedge fund manager on speed dial...
Meet Enrique Abeyta, one of Wall Street’s most successful hedge fund managers. With years of experience managing billions of dollars and navigating the highs and lows of the financial markets, Enrique delivers unparalleled market insights straight to your inbox.
In Truth & Trends, Enrique shares his personal take on what’s moving the markets, revealing strategies that made him a star in the world of high finance. Whether it’s uncovering the next big trend or breaking down the hottest stocks and sectors, Enrique’s insights are sharp, actionable, and proven to work in any market condition.
Inside these daily updates, you’ll gain:
- 50 years of combined trading wisdom distilled into actionable insights.
- A behind-the-scenes look at how Wall Street pros spot opportunities and avoid pitfalls.
- Exclusive strategies that Enrique personally uses to deliver exceptional returns — no fluff, just results.
To have Truth & Trends sent directly to your inbox every weekday, just enter your email address below to join this exclusive community of informed traders.
Don’t miss your chance to learn from one of the best in the business.
Sign up now and take your trading game to the next level.
3 "Stay-Away-From-Tech" Trades - TGT, INCY, SBUX
Posted July 17, 2026
By Greg Guenthner

The One Question I Ask Before Buying Any Stock
Posted July 16, 2026
By Enrique Abeyta

The Biggest IPO You Never Heard About
Posted July 13, 2026
By Enrique Abeyta
My Tesla Calls Went to Zero... Just as I Planned
Posted July 10, 2026
By Greg Guenthner

Mark Twain Was Right About Your Newsfeed
Posted July 09, 2026
By Enrique Abeyta