
Posted December 05, 2024
By Enrique Abeyta
The Invisible Hand of Year-End Trading
The trick to year-end trading success is understanding how Wall Street gets paid.
When you listen to the “smart” money they’ll have you believe stock prices always reflect the value of the company.
The academic idea is that the current stock price is the sum of discounted value of the future cash flows. What does all that mean?
There have been hundreds of books written on the subject. They’re good to read if you want to sound smart to your friends.
But if you want to actually make money, don’t waste your time. The smart money is dead wrong.
The stock market is driven by the forces of supply and demand, especially in the short term. This means there are many factors driving stock prices besides valuations.
One of those is the time of the year, or seasonality. And it’s especially powerful around this time of the year.
Even with the rise of passive investing, more than half of stock market assets are in actively managed funds.
These funds are compensated based on their performance.
For mutual funds, this performance is typically based on how much they outperformed or underperformed a certain index. For hedge funds, it’s usually calculated on an absolute basis.
There’s a weird quirk around these performance calculations, though: they’re all geared toward the end of the calendar year.
If you step back and think about this, it really doesn’t make any sense…
For instance, a manager could have a flat performance all year, be up 15% in December and then get crushed in January, and he’ll still collect a fat bonus.
Yearly performance is somewhat binary; you’re either up or down.
What money managers care about most is being in the black and avoiding losing their investors’ money at all costs.
Because managers are compensated based on the mark at the end of the year, they’re highly incentivized to do whatever they can to create positive returns by yearend.
I went back to the S&P 500’s inception in 1957 and analyzed the price history going into the final two months of the year.
Here’s what I found…
When Money Managers See Red
Let’s look at the years when the market was down 10% or more heading into November. In that scenario, most managers will likely also be down for the year.
Paradoxically, this means they may be less risk-averse. If these managers are already going to post a loss for investors, then the difference between a 7% loss and a 10% loss isn’t a big deal, right?
Take a look at the market’s performance during these ten instances…
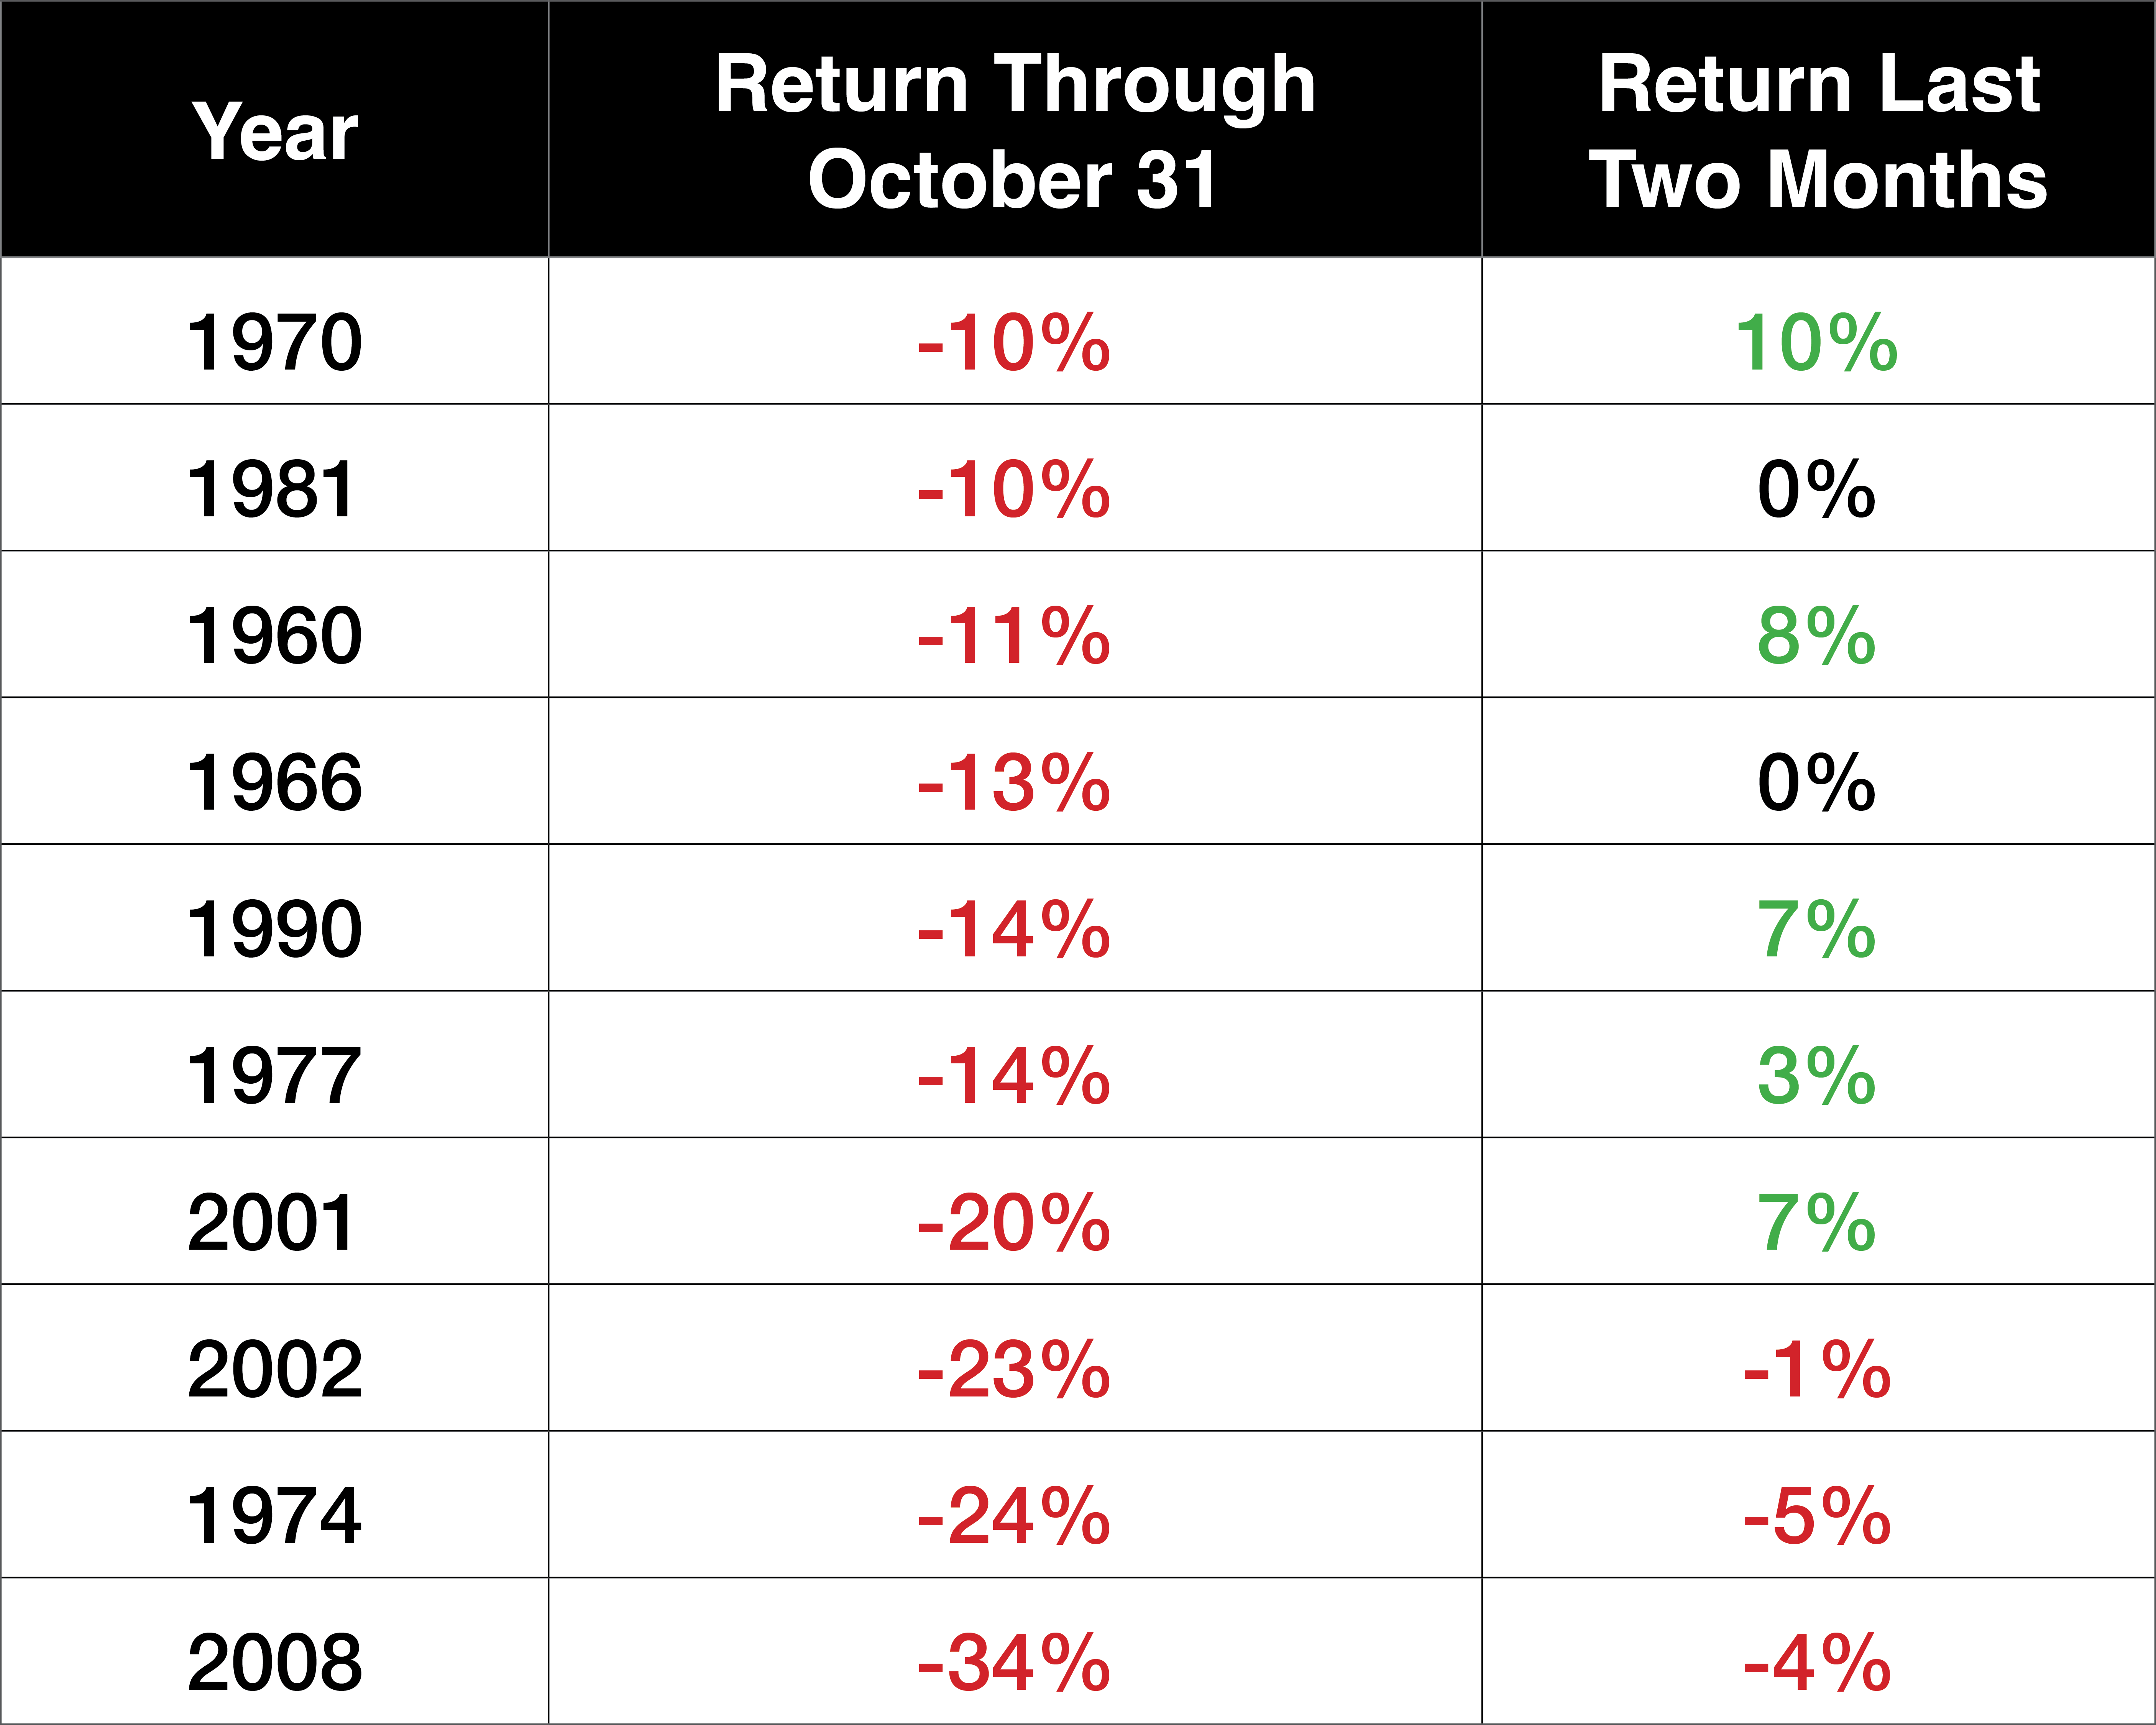
When the market is getting crushed, it tends to continue to get crushed. The three times the market was down the most going into the end of October, stocks fell even more to close the year.
Interestingly, the other instances saw strong performance to close out the year. In those years, managers had little to lose, so they pushed their bets.
Across all of these bad periods, the market was either up or flat 70% of the time in the last two months of the year.
The Real Danger
December stock returns are sluggish when the markets are close to flat or slightly down by the end of October. Take a look…
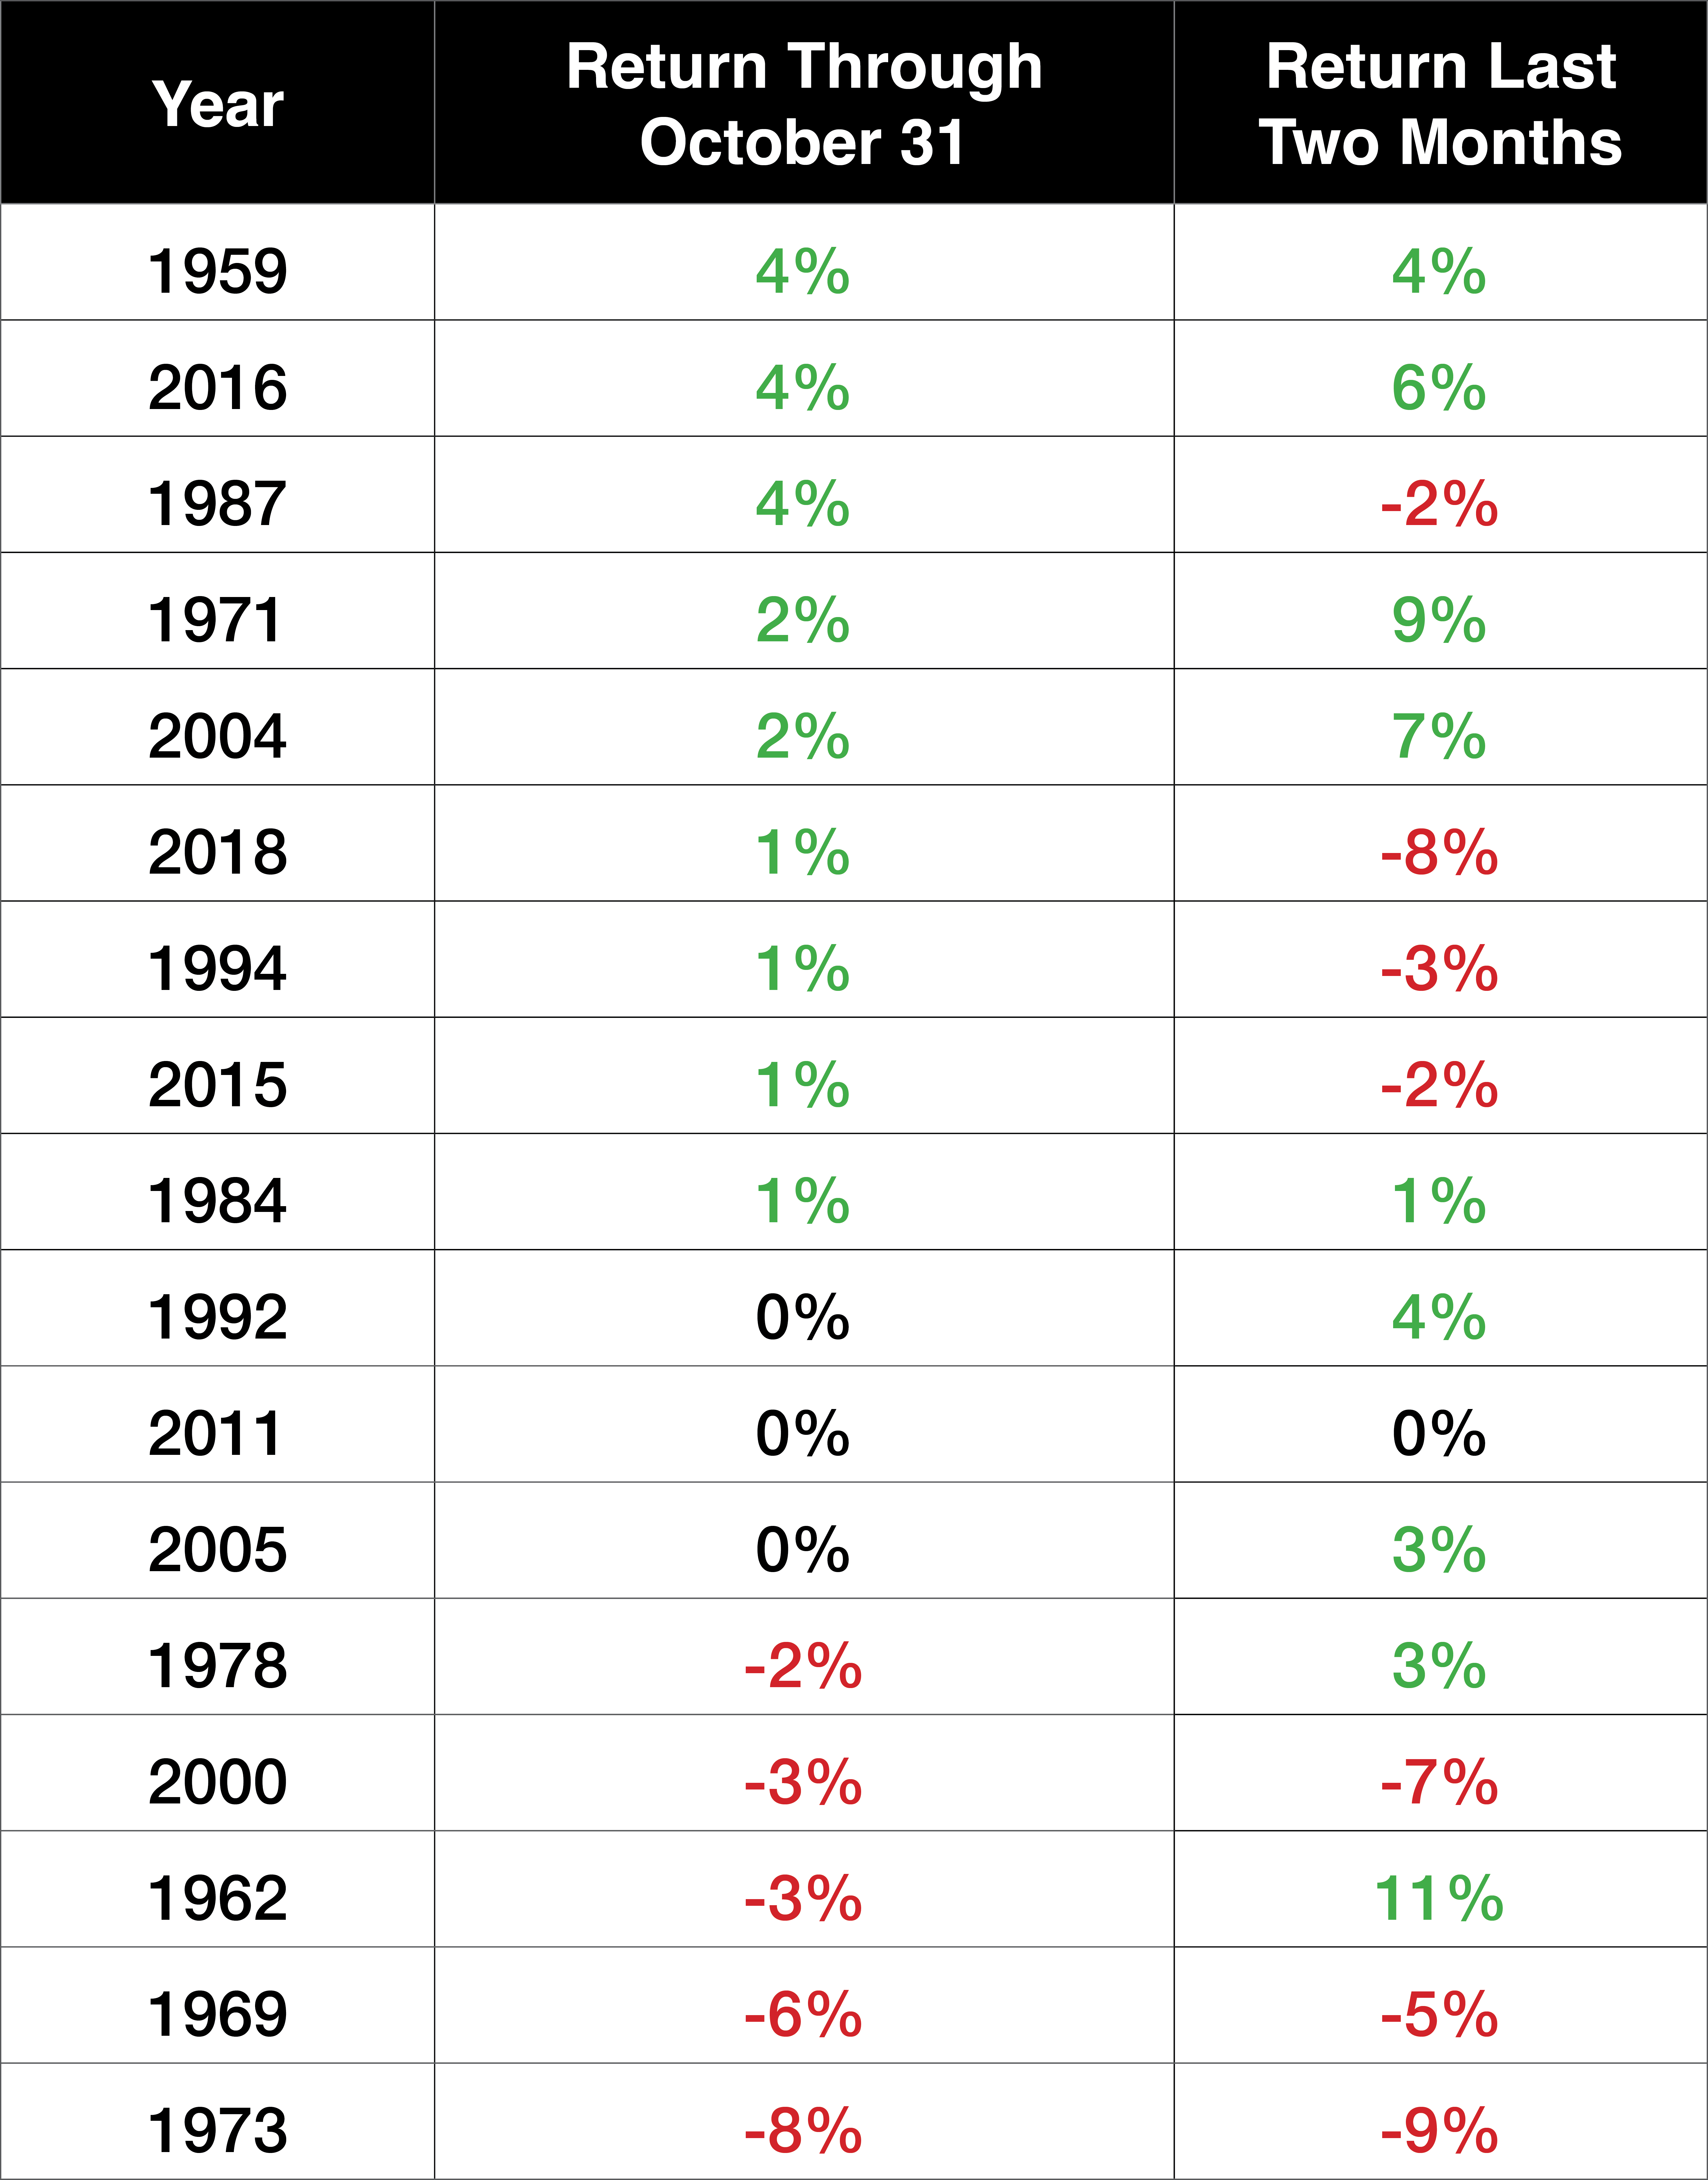
The performance is noticeably worse. Imagine you’re a money manager…
It’s the end of October and your performance is roughly flat on the year. In this scenario, you’re highly motivated to stay in the black.
This means you’re much more risk-averse. If a stock turns against you, you’re more likely to sell it and reduce your overall risk exposure.
When all the money managers do this at once, it pulls the whole stock market lower.
Where We Stand Today
Through November 30, the S&P 500 was up 25.5%. This is only the tenth time that the market has been up by 20% or more at that point of the year in the last forty years.
Take a look at the market’s performance when it’s up at least 20% by the end of November…
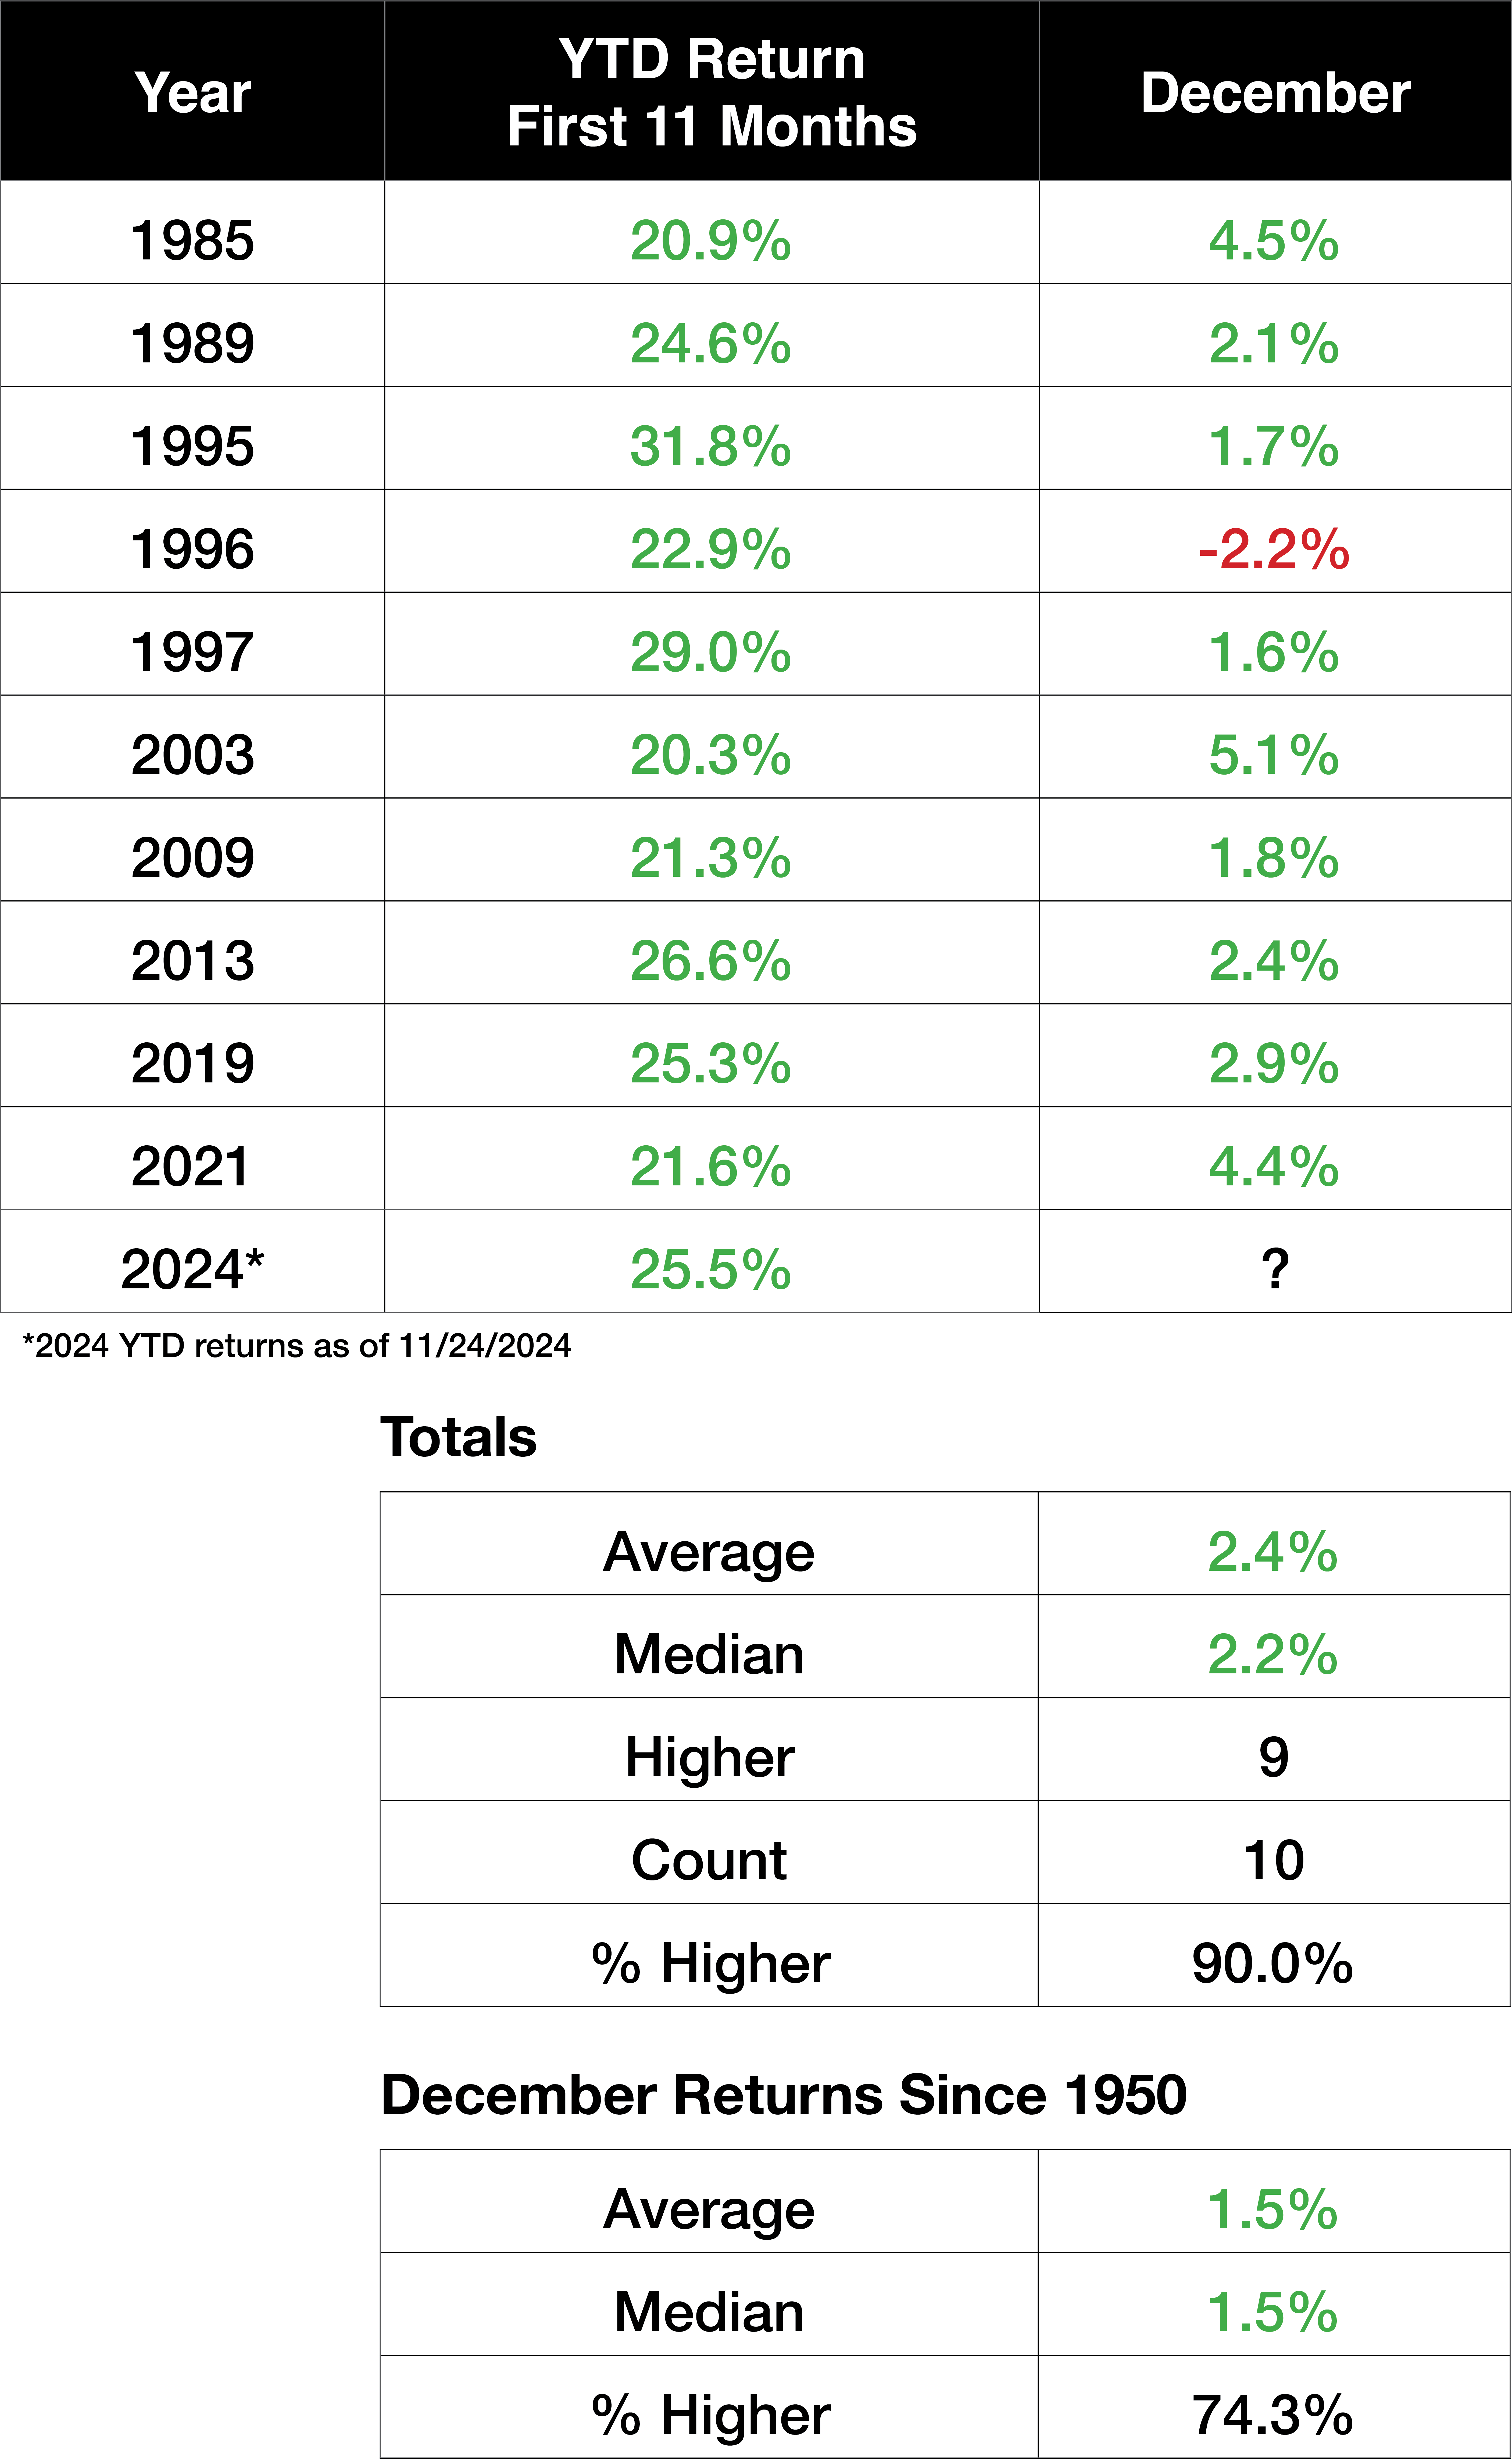
Here, the market finished the year higher in 9 out of 10 instances.
If you’re a money manager and the market is up big on the year, you’re much less likely to panic and more likely to hold your positions.
Through yesterday’s close, the S&P 500 was up about 0.77% in the first three days of December.
Does this mean the market will be up more through year’s end? It’s impossible to know for certain.
But history is on your side, and so are the powerful psychological forces that influence money managers.
Sign Up Today for Free!
Truth & Trends brings you market insights and trading tips you won't find anywhere else — unless you have your own personal hedge fund manager on speed dial...
Meet Enrique Abeyta, one of Wall Street’s most successful hedge fund managers. With years of experience managing billions of dollars and navigating the highs and lows of the financial markets, Enrique delivers unparalleled market insights straight to your inbox.
In Truth & Trends, Enrique shares his personal take on what’s moving the markets, revealing strategies that made him a star in the world of high finance. Whether it’s uncovering the next big trend or breaking down the hottest stocks and sectors, Enrique’s insights are sharp, actionable, and proven to work in any market condition.
Inside these daily updates, you’ll gain:
- 50 years of combined trading wisdom distilled into actionable insights.
- A behind-the-scenes look at how Wall Street pros spot opportunities and avoid pitfalls.
- Exclusive strategies that Enrique personally uses to deliver exceptional returns — no fluff, just results.
To have Truth & Trends sent directly to your inbox every weekday, just enter your email address below to join this exclusive community of informed traders.
Don’t miss your chance to learn from one of the best in the business.
Sign up now and take your trading game to the next level.

Silver's Swan Dive Is Just the Beginning
Posted February 02, 2026
By Enrique Abeyta

Lightning Round: Trump’s Fed Pick, the Silver Crash, and More
Posted January 30, 2026
By Greg Guenthner

Forget the Noise, You're Not Bullish Enough
Posted January 29, 2026
By Enrique Abeyta
Small Caps Are Back, Baby!
Posted January 23, 2026
By Greg Guenthner

Greenland, Carry Trades, and Lazy CNBC Takes
Posted January 22, 2026
By Enrique Abeyta

