Posted December 19, 2024
By Enrique Abeyta
Yesterday’s Selloff Triggered a Rare Setup
Broad selling pressure hit the market yesterday, the S&P 500 fell nearly 3%, and everyone’s scrambling to explain why.
The headlines are blaming Jerome Powell’s comments about minimal rate cuts next year.
But here’s the truth: the media wants you to obsess over every little data point. That’s how they get you to click.
The reality? Big moves like this rarely happen because of the news. They happen when traders shift their positions – and that’s where opportunity lies for you.
Drops like yesterday’s don’t happen often. And history shows they usually snap back, especially this time of year.
Here’s why betting on stocks right now is a high-probability win…
Putting Yesterday’s Selloff in Perspective
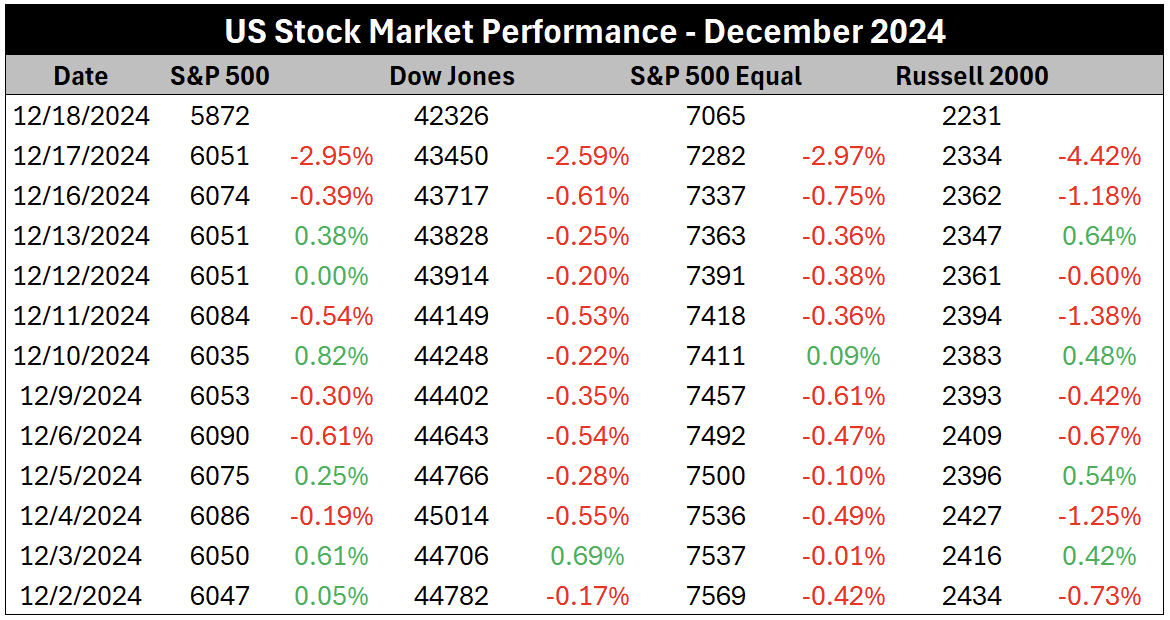
Here is a table showing the performance of the major indices for every day in December…

The Dow Jones and equal-weighted S&P 500 have been down every single day of the month. The sell-off in these two indices was joined by the S&P 500 and Russell 2000 and culminated in a terrible day for the stock market.
But coming into December — and after the re-election of Donald Trump — the market had risen relentlessly for months. It was clear the stock market indices were very extended.
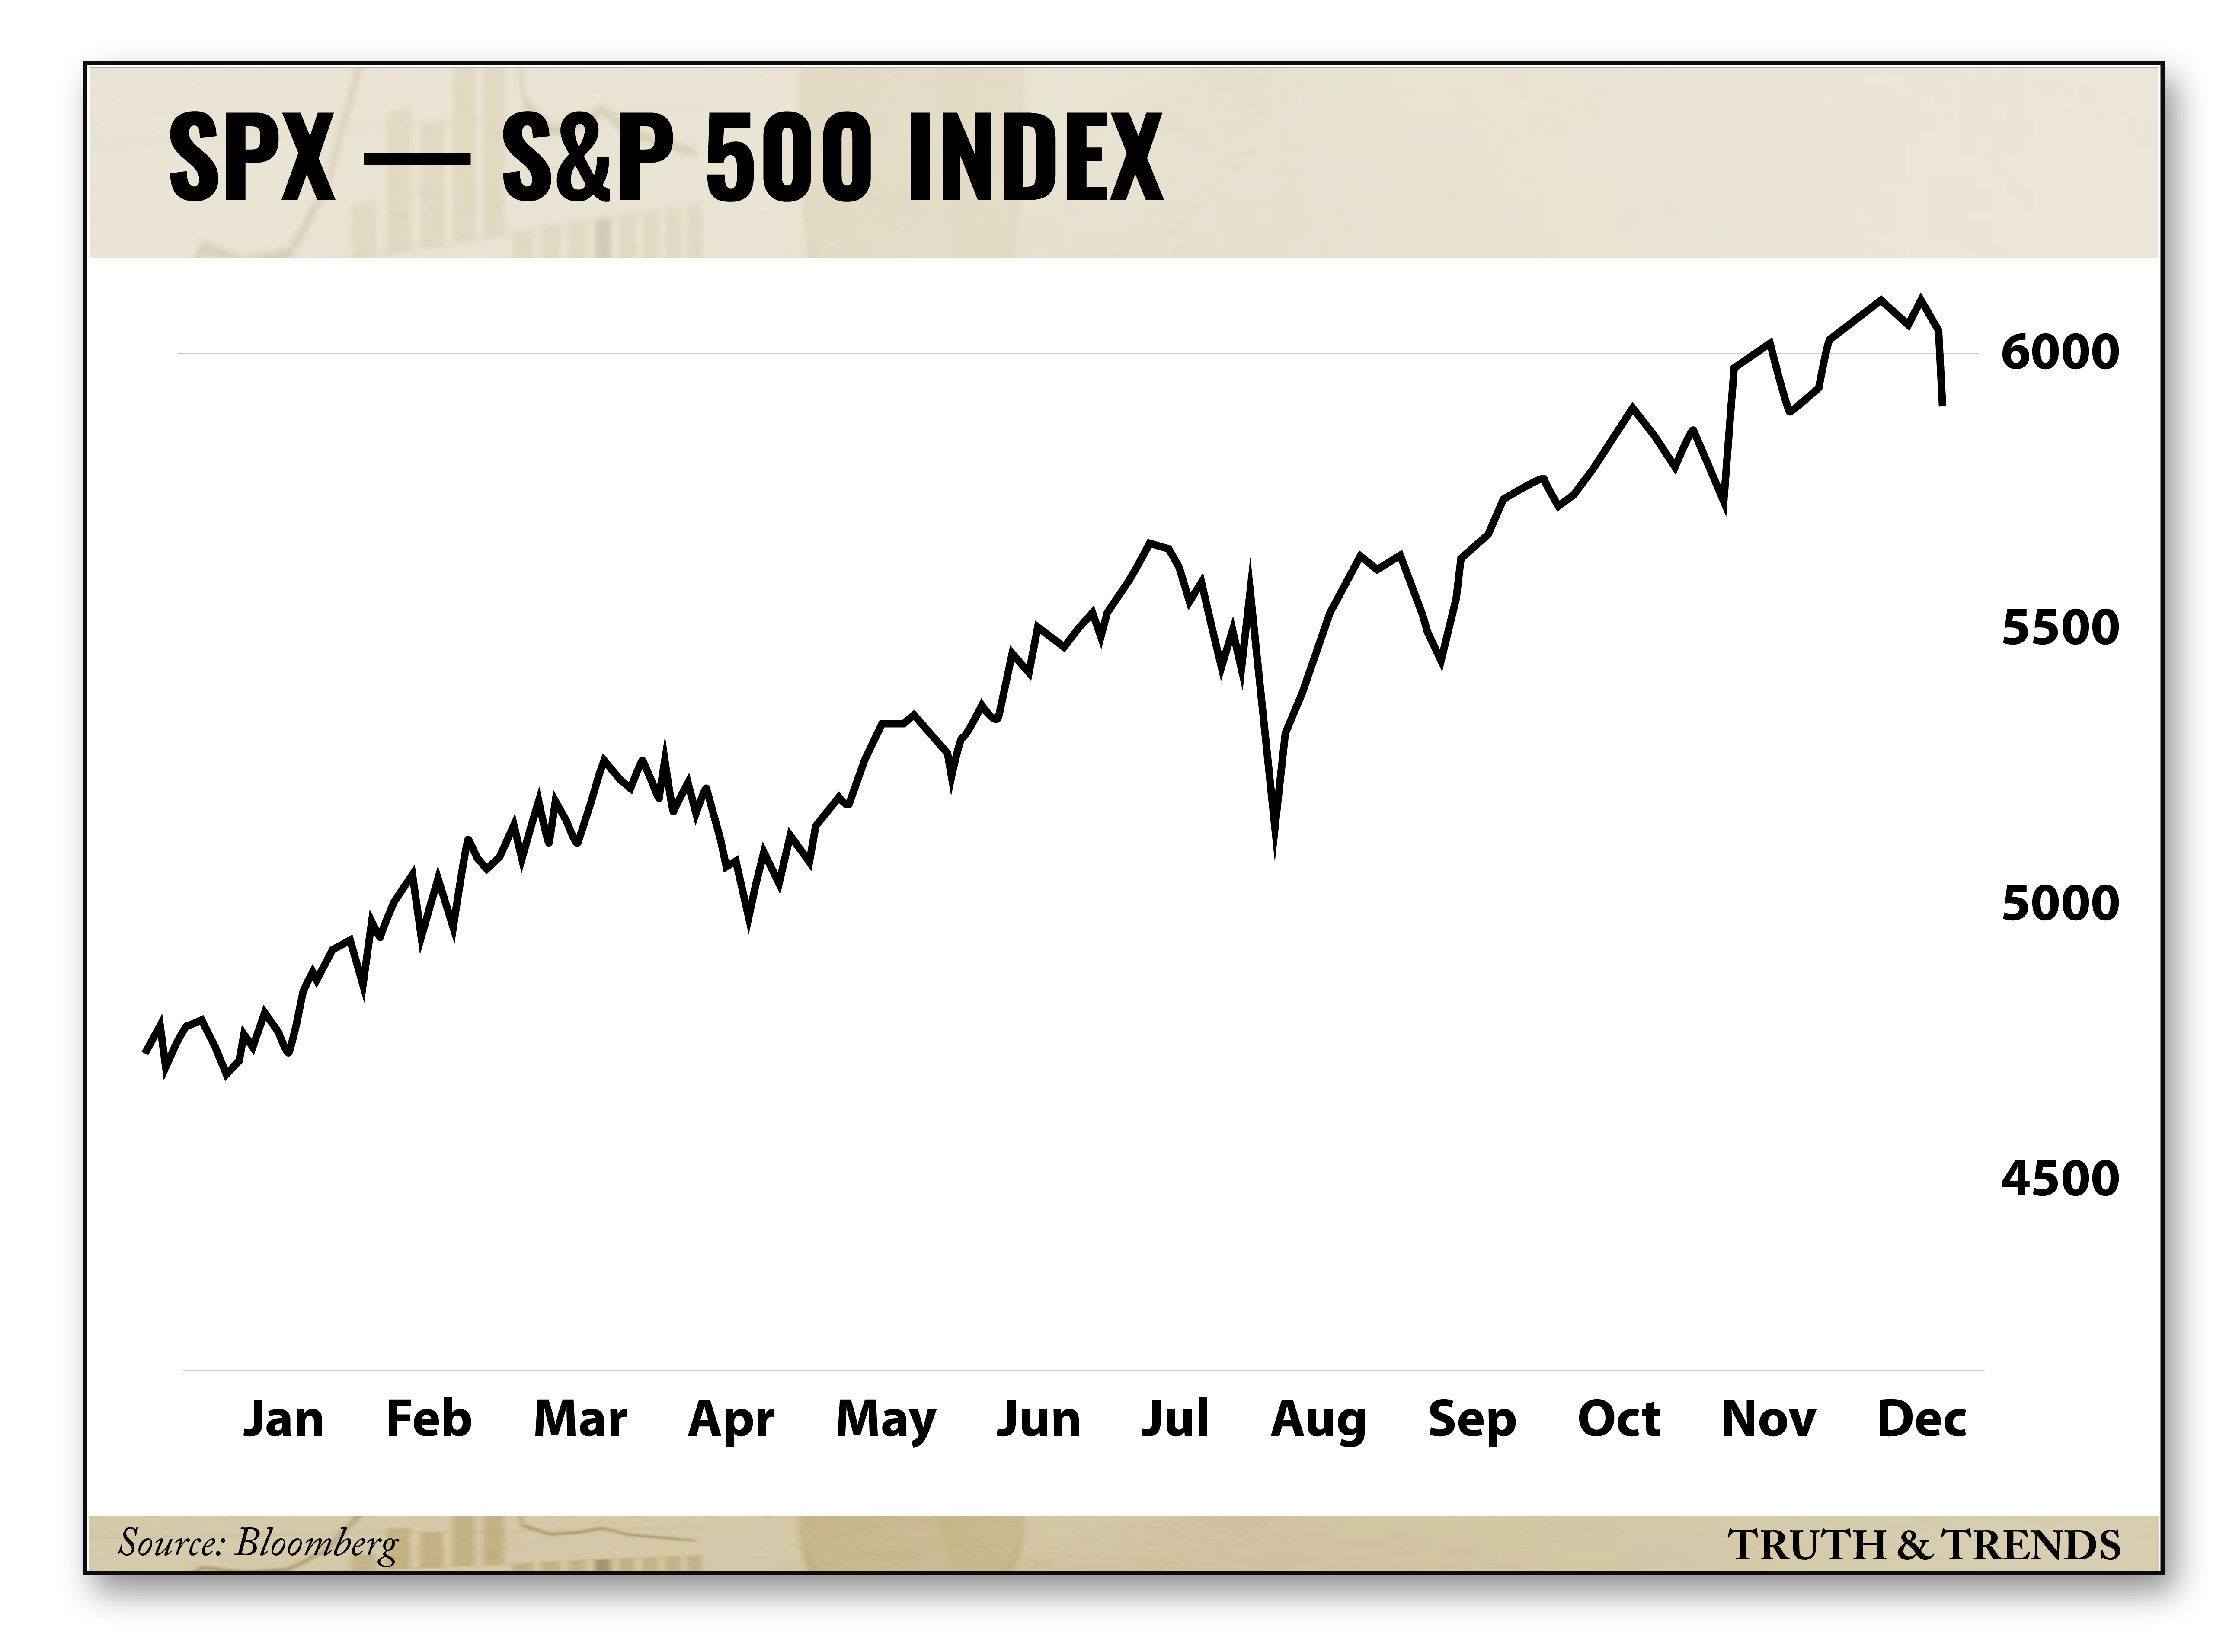
Here is a chart of the S&P 500 over the last year…

On the chart, you can see how the stock market went up since the August flurry downward on the potential unwind of the Japanese yen carry trade.
Going into yesterday’s trading — even though most of the indices were down during December — the S&P 500 was very extended from its 50-day moving average.
That all changed yesterday with the big drop in stocks, which you can see in the chart.
This selloff actually looks a lot like the one we had back in early August.
My experience has taught me that big drops like this usually snap back, especially this time of year.
Remember that almost every professional money manager out there is up for the year. Many of them also are compensated based on their year-end performance.
That doesn’t make any logical sense, but that’s how it’s done.
This means they’re much more willing to buy stocks while they are down to support their positions. Especially on the back of the kind of “news” we just got — an unimportant change in the bias of the Federal Reserve.
I think there’s a high probability that the stock market will snap back before year-end. Let’s look at the data…
The Odds of a Snapback
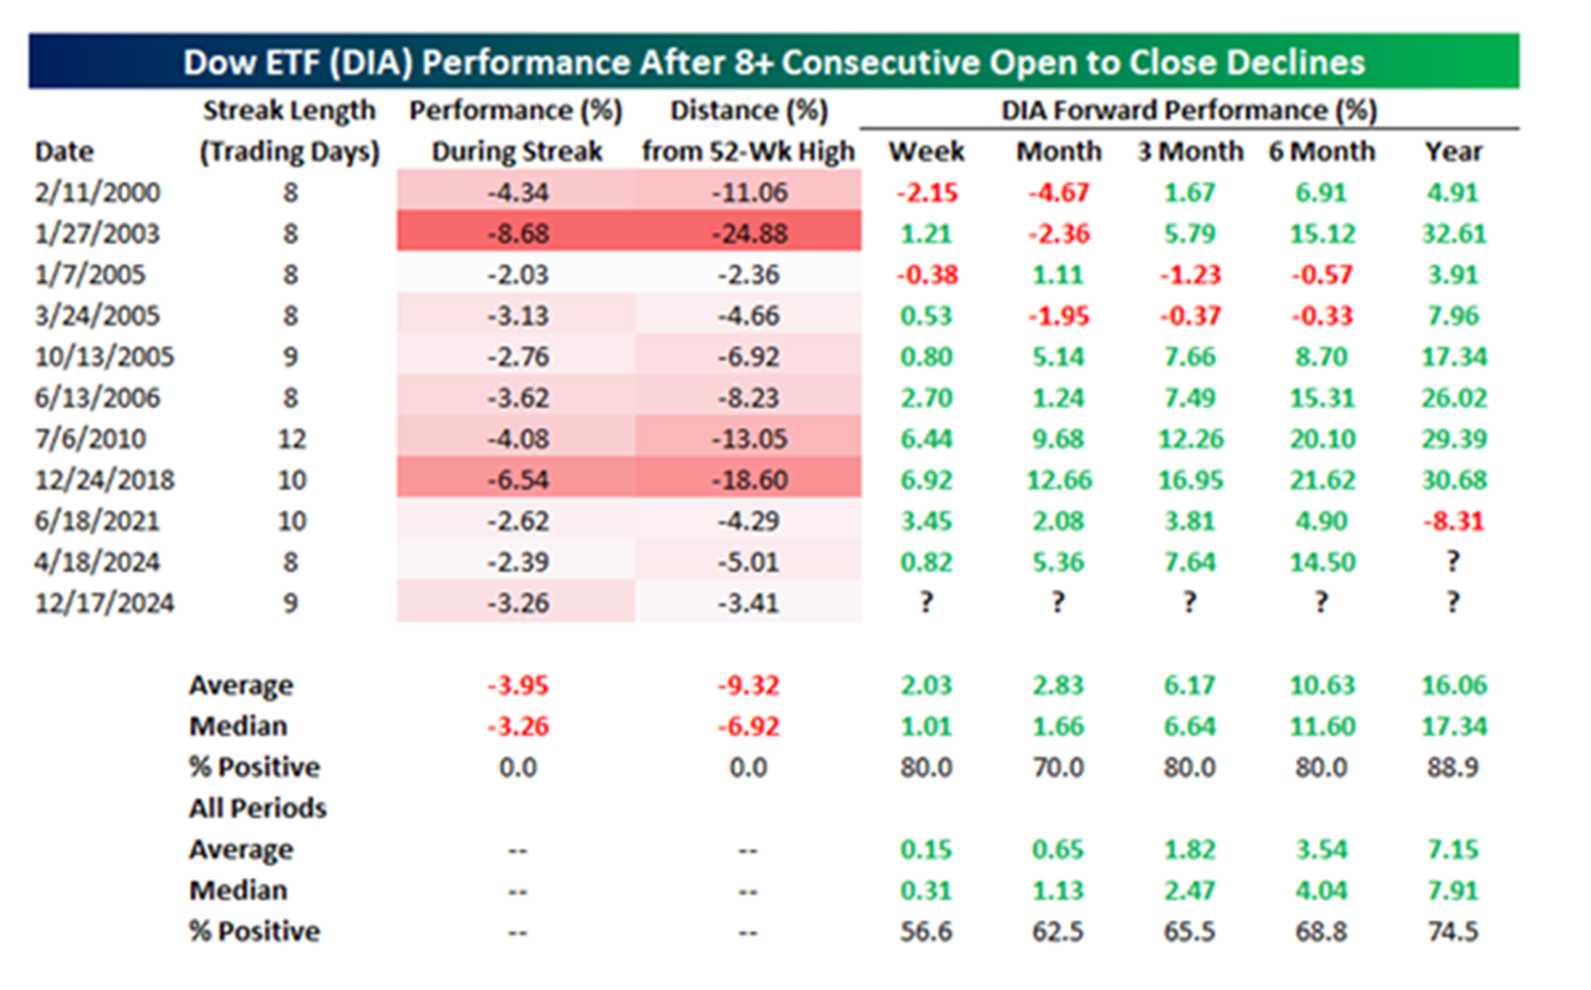
The Dow Jones has done something relatively unique by posting eight consecutive “open to close declines.” This means that it traded down over the course of the trading day.
This could happen on any normal day, but for it to happen eight days in a row is quite rare.
Here is a table from Bespoke Investment Group showing what the stock market has done one week, one month, three months, six months and one year after these occurrences…

Source: Bespoke Investment Group
The Dow has been higher 70-90% of the time, a good amount. At the bottom of the table, you can see how this compares to the stock market on average.
Betting on stocks right now is a high-probability bet.
Here is another table from Jeffery Hirsch of Almanac Trader showing the previous times when the Dow Jones traded down at least nine days in a row. It is now down ten days in a row.

Source: Stock Trader's Almanac 2024
For many traders, this data might be surprising. It shows that looking out one week, two weeks, one month, and three months ahead — the stock market is up the majority of the time.
You can put this in perspective by looking at the table from Bespoke above. Again, betting on stocks right now is a high-probability bet.
Checking Underneath the Hood
I’m sure you’ve heard the talking heads discussing breadth, or the measurement of how many stocks in the S&P 500 are higher on the day versus lower.
It’s widely followed when markets fall under selling pressure. Unfortunately, it’s often misunderstood.
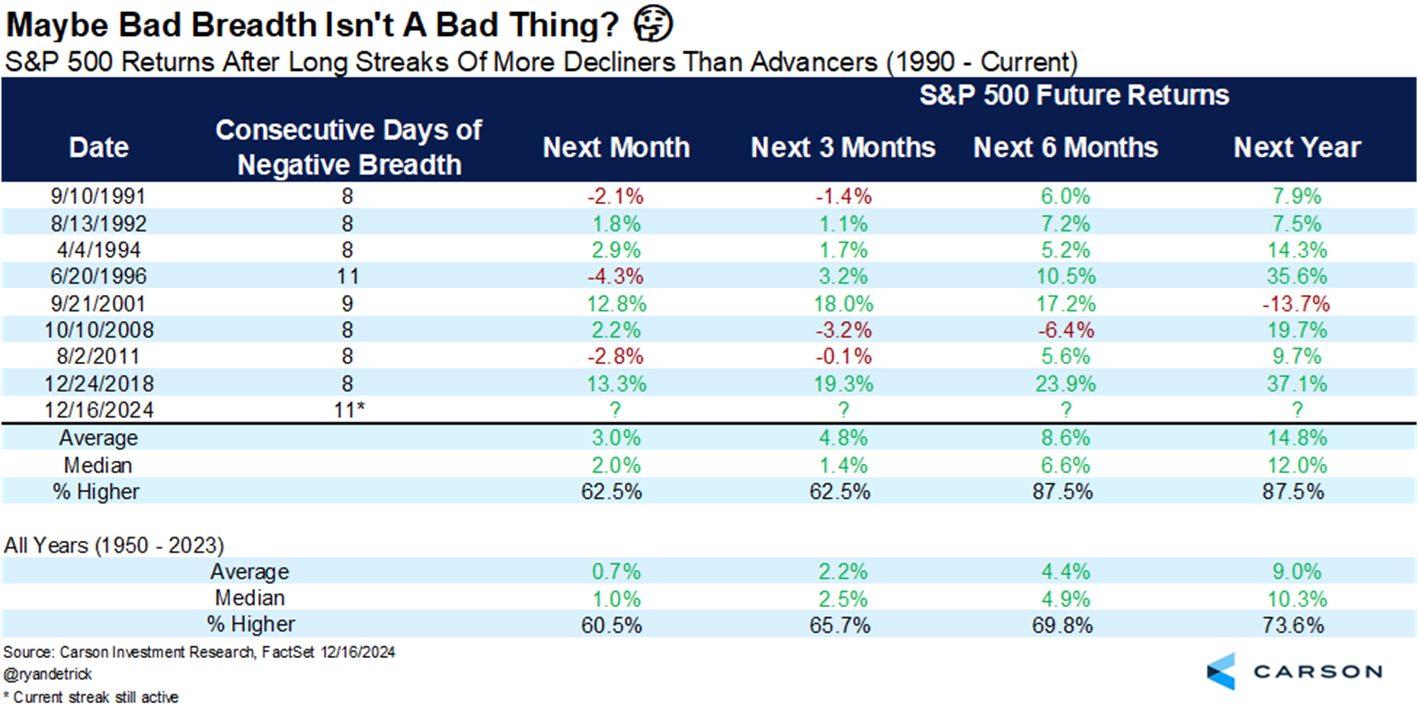
Recently, we have seen a 12-day streak of consecutive days with negative breadth in the S&P 500 (more stock printing fresh lows than new highs). This has happened only a handful of times in the last 35 years.
Here is a table from one of my favorite analysts, Ryan Detrick of Carson Investment Research. It shows how the S&P 500 has performed afterward in the next month, three months, six months, and one year forward…

Source: Carson Investment Research
The data lines up well with the previous data set. In the near term, stocks do much better than average after these periods.
The current selling pressure might feel terrible for most investors, but history tells us that being open to further upside is the best strategy.
It’s a high-probability bet — and one that I think will pay off soon!
Sign Up Today for Free!
Truth & Trends brings you market insights and trading tips you won't find anywhere else — unless you have your own personal hedge fund manager on speed dial...
Meet Enrique Abeyta, one of Wall Street’s most successful hedge fund managers. With years of experience managing billions of dollars and navigating the highs and lows of the financial markets, Enrique delivers unparalleled market insights straight to your inbox.
In Truth & Trends, Enrique shares his personal take on what’s moving the markets, revealing strategies that made him a star in the world of high finance. Whether it’s uncovering the next big trend or breaking down the hottest stocks and sectors, Enrique’s insights are sharp, actionable, and proven to work in any market condition.
Inside these daily updates, you’ll gain:
- 50 years of combined trading wisdom distilled into actionable insights.
- A behind-the-scenes look at how Wall Street pros spot opportunities and avoid pitfalls.
- Exclusive strategies that Enrique personally uses to deliver exceptional returns — no fluff, just results.
To have Truth & Trends sent directly to your inbox every weekday, just enter your email address below to join this exclusive community of informed traders.
Don’t miss your chance to learn from one of the best in the business.
Sign up now and take your trading game to the next level.

The Kill Switch: How a Hidden Algorithm Is Blowing Up Boring Stocks
Posted February 16, 2026
By Enrique Abeyta

Snapback Trade Watchlist: HOOD, SHOP, TOST
Posted February 13, 2026
By Greg Guenthner

Play Ball! 3 Investing Rules From the Baseball Diamond
Posted February 12, 2026
By Enrique Abeyta

This Feels Like 1999… NOT 2000
Posted February 09, 2026
By Enrique Abeyta

Bad Vibes Everywhere
Posted February 06, 2026
By Greg Guenthner

