
Posted November 03, 2025

By Enrique Abeyta
When Seasonality Meets "Situationality"
To most investors, seasonality sounds like voodoo. But there’s nothing mystical about it.
When you look through historical stock performance, the market clearly tends to perform better during certain times of the year.
November is the best month of the year for the market, and December is another seasonally strong month.
Taxes, year-end compensation for money managers, and earnings all play a role. Whatever the reason, stocks often finish the year on a high note.
But there’s another force at work that’s just as important — what I call “situationality.”
This is simply the effect of recent stock market performance on what happens next.
With October in the books, the S&P 500 and Dow have now logged six straight months of gains (seven for the Nasdaq).
So the question now is: how does the market perform heading into year-end when it’s already running hot?
Let’s take a look at what the data says.
A Rare Setup for Year-End Gains
The combination of seasonality and situationality over the next two months is very bullish for the stock market.
Here are some good charts from one of my favorite market strategists, Ryan Detrick from Carson Investment Research.
The first one shows how the stock market performs in November and December when the S&P is up more than 15% year-to-date by the end of October.
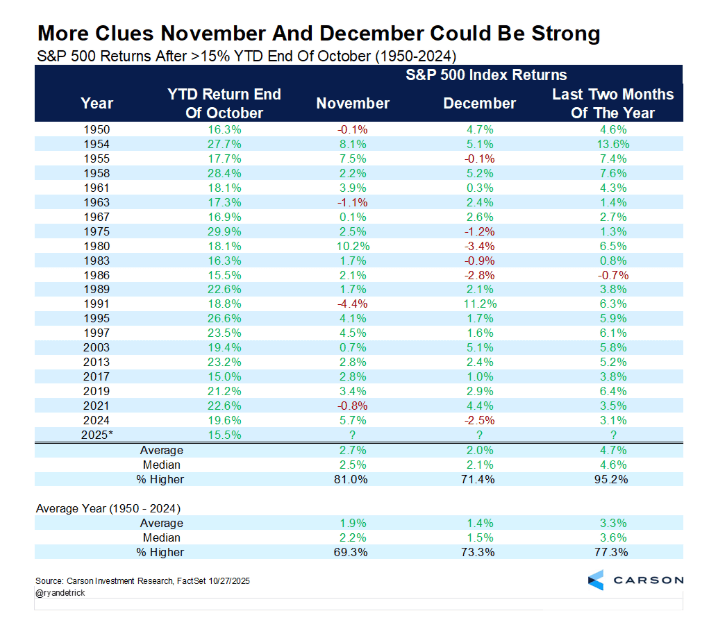
On the chart, you can see that November is up 81% of the time, December is up 71% of the time, and the index is up 95% of the time with the two months combined.
The S&P 500 is also up by almost 5% on average. Pretty good for just two months!
Here is another one from a technical analyst named Seth Golden.
This table shows the performance of the S&P 500 in November and December, when the period from May to October is up 10% or more.
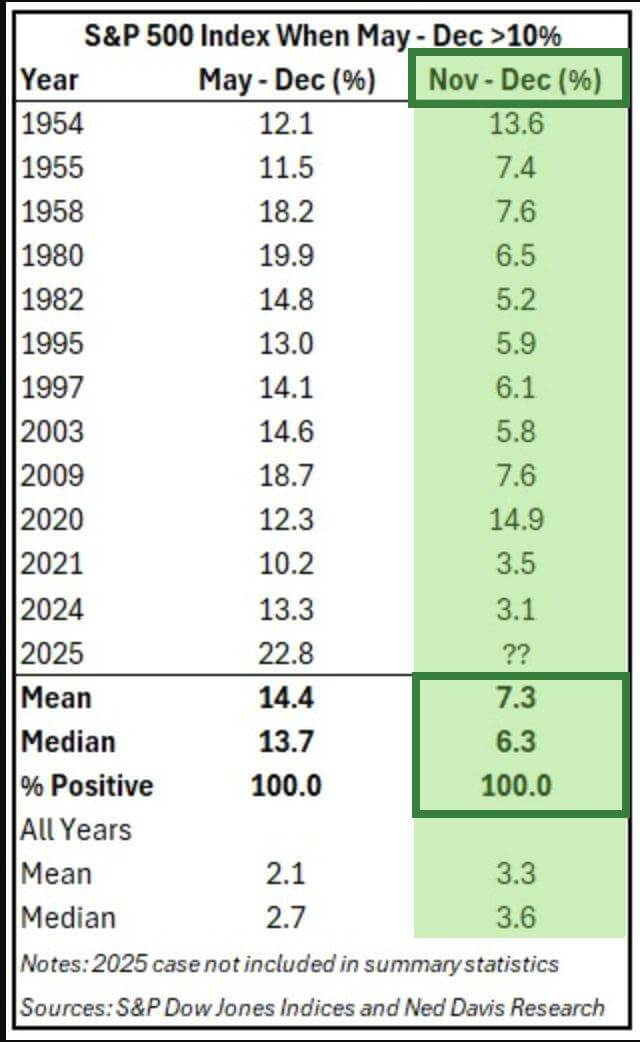
This has happened 12 times since 1950. And each of those 12 times, the stock market has been higher in the final two months.
Here is another similar analysis from Ryan Detrick. It shows the final two-month performance of the S&P 500 when it’s seen positive performance each month from May to October.
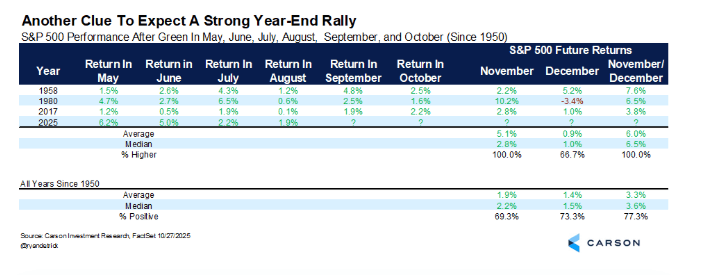
This is only the fourth time this has happened in the last 75 years.
Each of the previous three times this happened, the S&P has been up over the next two months with an average return of 6%.
These analyses are so powerful because they combine the current situationality with strong seasonality.
Where We Go From Here
Here are a few more charts showing the seasonality of year-end stock market performance.
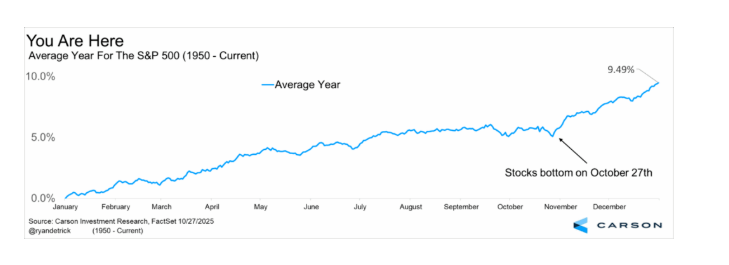
This first shows that last Monday (Oct. 27) is the date when we typically see the final bottom on the S&P 500 before it grinds higher into the end of the year.
Here is another one that shows the performance of the stock market going forward historically based on three-month rolling periods. It shows the period from November to January.

You can see on the chart that this period is by far the best for the stock market, especially the tech-heavy Nasdaq Composite.
And finally, here is one last chart from Ryan Detrick at Carson. This one combines even more about the situationality.
It combines market performance for every year, the past 20 years, this year of a presidential cycle, a year following a +20% year, and a positive January/February.
It then builds a composite to show what happens next.
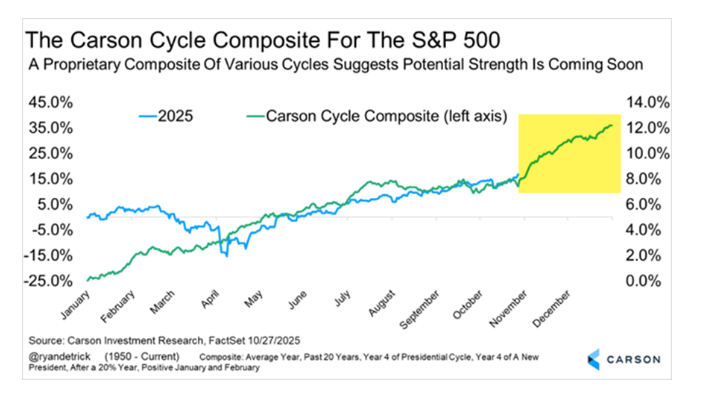
History would imply we have a great couple of months ahead of us.
The combination of seasonality and situationality has lined up perfectly this year — and history suggests it’s a powerful setup.
So game on!
Sign Up Today for Free!
Truth & Trends brings you market insights and trading tips you won't find anywhere else — unless you have your own personal hedge fund manager on speed dial...
Meet Enrique Abeyta, one of Wall Street’s most successful hedge fund managers. With years of experience managing billions of dollars and navigating the highs and lows of the financial markets, Enrique delivers unparalleled market insights straight to your inbox.
In Truth & Trends, Enrique shares his personal take on what’s moving the markets, revealing strategies that made him a star in the world of high finance. Whether it’s uncovering the next big trend or breaking down the hottest stocks and sectors, Enrique’s insights are sharp, actionable, and proven to work in any market condition.
Inside these daily updates, you’ll gain:
- 50 years of combined trading wisdom distilled into actionable insights.
- A behind-the-scenes look at how Wall Street pros spot opportunities and avoid pitfalls.
- Exclusive strategies that Enrique personally uses to deliver exceptional returns — no fluff, just results.
To have Truth & Trends sent directly to your inbox every weekday, just enter your email address below to join this exclusive community of informed traders.
Don’t miss your chance to learn from one of the best in the business.
Sign up now and take your trading game to the next level.

Bitcoin Is Boring
Posted June 05, 2026
By Greg Guenthner

What History's Biggest IPOs Say About SpaceX
Posted June 04, 2026
By Enrique Abeyta

Someone Knows Something About Tesla
Posted June 03, 2026
By Nick Riso

For Whom the IPO Bell Tolls (SpaceX)
Posted June 01, 2026
By Nick Riso

Reports of Software's Death Are Greatly Exaggerated
Posted May 29, 2026
By Greg Guenthner
