![[Warning] This Signal Is Screaming "CORRECTION!"](http://images.ctfassets.net/vha3zb1lo47k/3rOhpDBPIM8gpurHo5x9nk/10dd24605b663383a62e3572e60968ad/ttr-issue08-04-25-img-post-2.jpg)
Posted August 04, 2025

By Enrique Abeyta
[Warning] This Signal Is Screaming "CORRECTION!"
Last Friday’s market drop caught a lot of investors off guard.
The headlines blamed a surprisingly weak jobs report. Not just soft numbers, but sharp downward revisions to prior data that rattled confidence.
But the truth is that the stock market didn’t need a reason to fall — it just needed an excuse.
Since the tariff-driven selloff back in April, the market has seen a rally of historic speed and strength.
Like any other sharp run-up, however, this one has become extended and overbought. Enthusiasm had gotten too rampant, leaving stocks vulnerable to a correction.
So yes, a stock market correction is coming, just as I’ve been saying for weeks. But it won’t happen for the reasons you’ll hear about.
The Real Reason Stocks Are in Trouble
Take a look at this chart of the S&P 500 over the last year. This chart includes my favorite short-term trading technical indicator, the relative strength index (RSI).
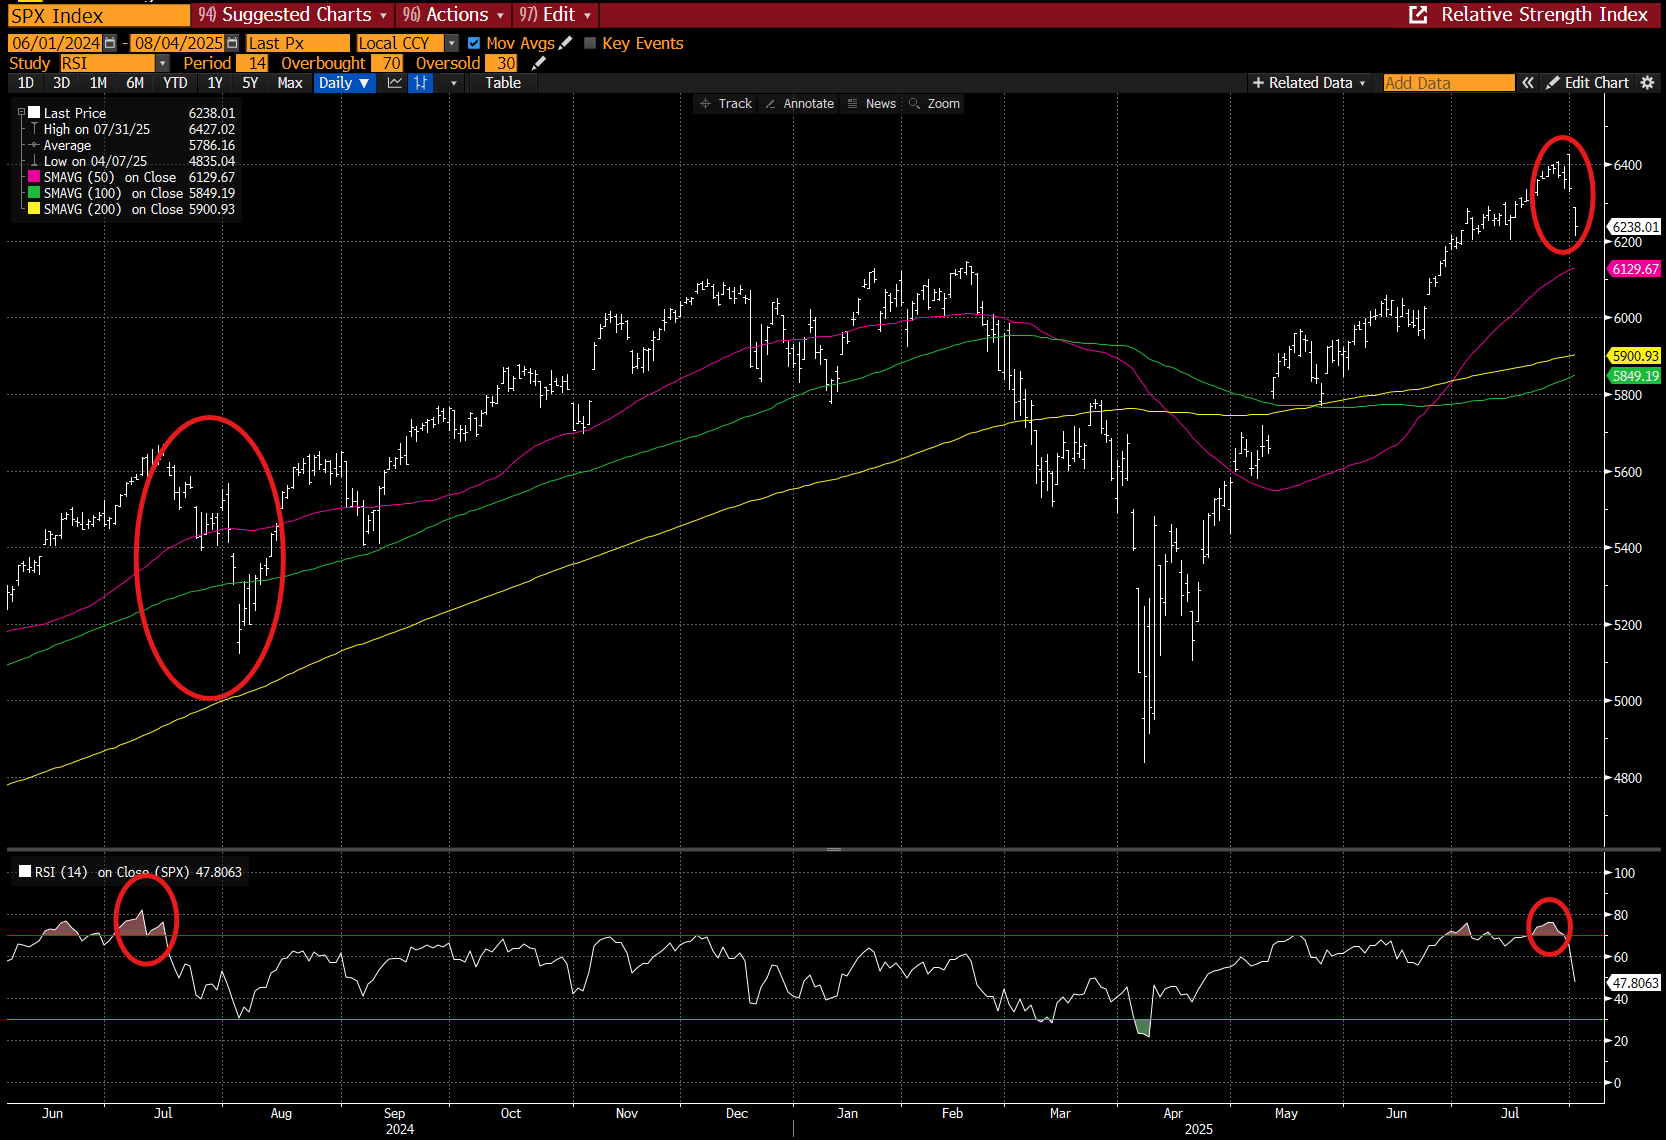
Source: Bloomberg
On the chart, I put red circles around the last time the S&P 500 had an overbought RSI (above 75) as high as it has been recently.
That was last July. As you can see, stocks plummeted shortly after.
The media would have you believe these were concerns about an unwind of the Japanese yen-carry trade. That’s a bunch of BS.
The selloff happened because stocks were way ahead of themselves and had become vulnerable to any news that could lead to a pullback.
Remember that in the short term, narrative usually follows price. In other words, the media takes whatever is happening at the time of the selloff and claims it is the catalyst — even if it isn’t.
I think we are seeing an identical situation right now.
Ostensibly, the selloff last Friday was on the back of a weak jobs report and negative revisions to prior numbers. The narrative is that the economy may be weaker than previously expected.
That narrative is being shared by the same sources that had been telling us days before that the economy was too strong and that Jerome Powell shouldn’t cut interest rates.
Honestly, I don’t have a strong opinion on either of these points.
I do, however, have a strong opinion on the stock market. It’s going down ( or at least violently sideways) before it goes higher again.
This is what always happens when stocks are this overbought and extended from the moving averages.
I also think that the selloff is beginning now. The manner in which it sold off on Friday gives us some historical precedent about what is likely to happen next.
More Evidence a Correction Is Coming
Here is a table from a great technical and macroeconomic analysis site called Subu Trade. It shows that the nature of Friday’s selloff is quite rare.
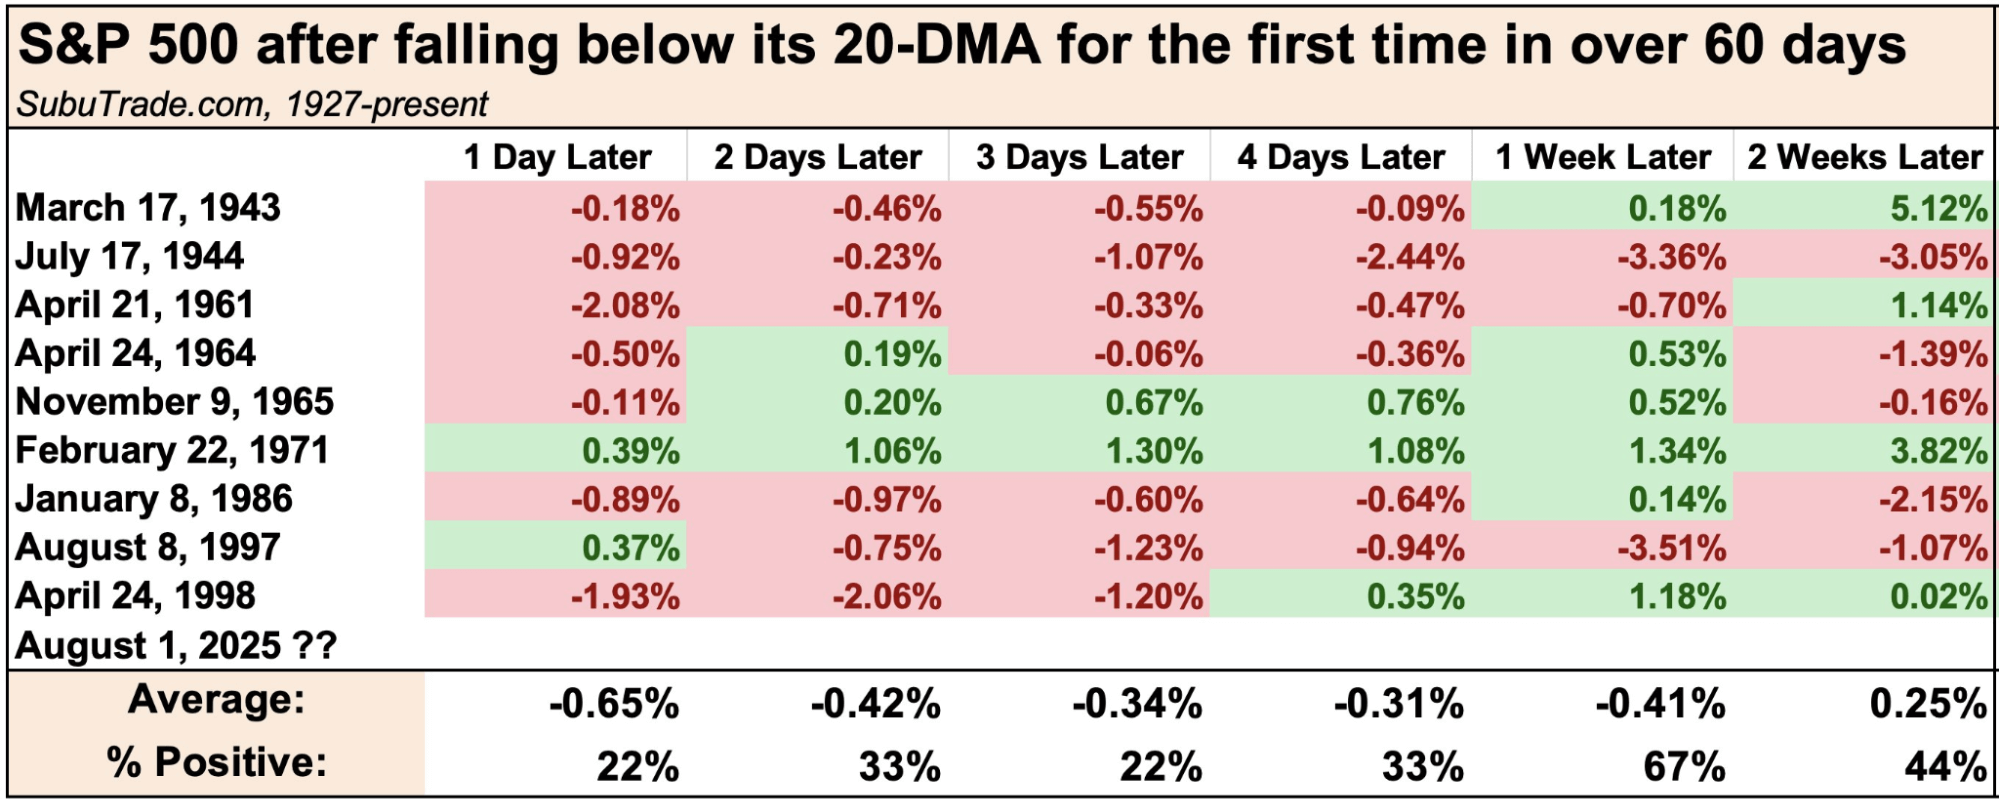
Source: Subu Trade
We just fell below the 20-day moving average for the first time in over 60 days, which has only happened nine other times going back to 1927.
When it has happened in the past, the stock market has gone down over the following weeks the majority of the time.
Keep in mind that the market is usually up at least two-thirds of the time over similar time frames, looking across all periods.
Below is another table from Almanac Trader.
It shows that when we break a streak where we have no moves of 1% (up or down) with a -1% down day (the S&P 500 was down 1.6% on Friday), we are also likely to trade lower.
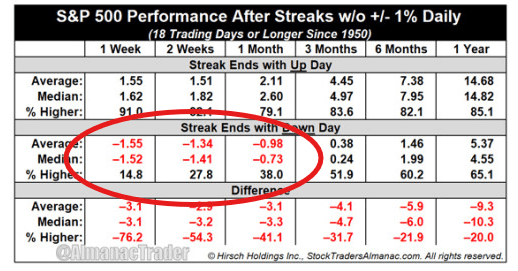
Source: Almanac Trader
The one-week, two-week, and one-month numbers are awful compared to historical precedent.
Here is another table of data from always awesome Ryan Detrick of Carson Group.
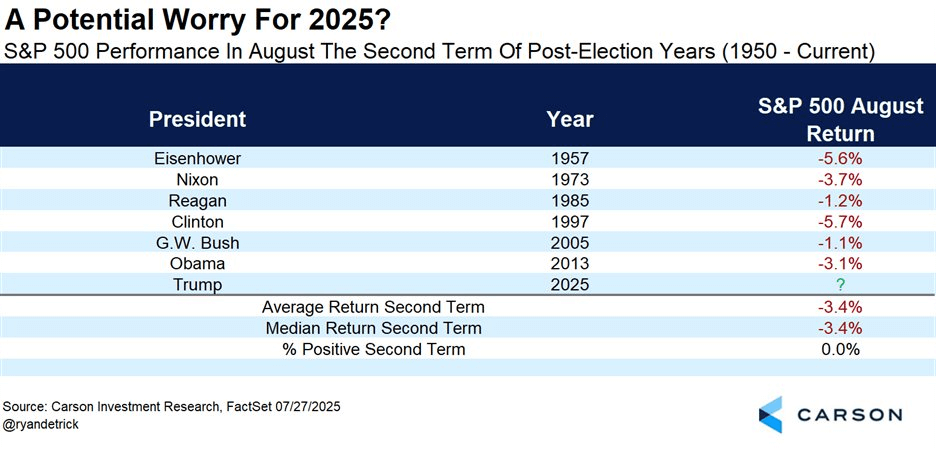
Source: Carson Investment Research
It shows that August has been a bad month for the stock market when we are in a president’s second term.
This data goes back to 1950, and the S&P 500 has been down every time by an average of 3.4% over the month.
I don’t think this data set is as strong as the other ones I shared. But I have to admit that the presidential cycle indicators historically have been quite strong.
Finally, let’s not forget the historical seasonality of the stock market. Here is a final table from our friend J.C. Parets of Trend Labs.
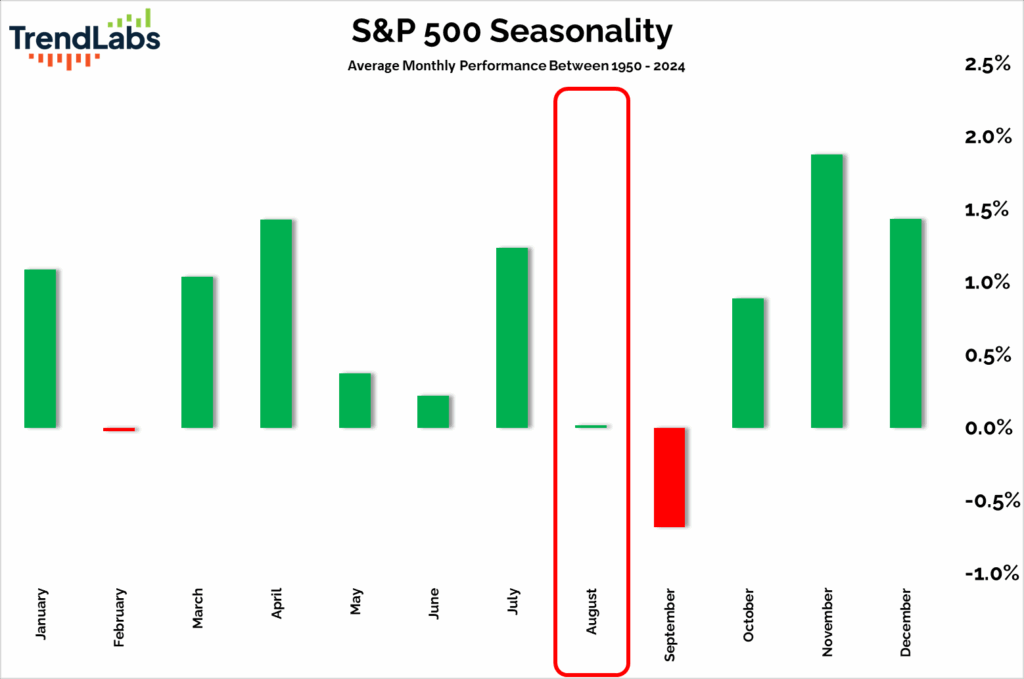
Source: Trend Labs
This data goes back to 1950 and shows that the next two months are historically difficult.
If we were not as overbought as we have been or if we hadn’t seen the dramatic selloff on Friday, maybe I would ignore this data.
But given the combination of the data sets above, I think investors should buckle up for a rough couple of weeks.
If the market drops from here — and the data says it probably will — don’t be surprised when the headlines come up with new reasons to explain it.
The truth, however, is that stocks are stretched and due for a reset. That’s the real signal — and it’s flashing red right now.
Sign Up Today for Free!
Truth & Trends brings you market insights and trading tips you won't find anywhere else — unless you have your own personal hedge fund manager on speed dial...
Meet Enrique Abeyta, one of Wall Street’s most successful hedge fund managers. With years of experience managing billions of dollars and navigating the highs and lows of the financial markets, Enrique delivers unparalleled market insights straight to your inbox.
In Truth & Trends, Enrique shares his personal take on what’s moving the markets, revealing strategies that made him a star in the world of high finance. Whether it’s uncovering the next big trend or breaking down the hottest stocks and sectors, Enrique’s insights are sharp, actionable, and proven to work in any market condition.
Inside these daily updates, you’ll gain:
- 50 years of combined trading wisdom distilled into actionable insights.
- A behind-the-scenes look at how Wall Street pros spot opportunities and avoid pitfalls.
- Exclusive strategies that Enrique personally uses to deliver exceptional returns — no fluff, just results.
To have Truth & Trends sent directly to your inbox every weekday, just enter your email address below to join this exclusive community of informed traders.
Don’t miss your chance to learn from one of the best in the business.
Sign up now and take your trading game to the next level.

Get Ready for $40 Oil
Posted June 18, 2026
By Enrique Abeyta

The Melt-Up Case Makes Itself
Posted June 15, 2026
By Enrique Abeyta

The SpaceX Hangover Trade
Posted June 12, 2026
By Greg Guenthner

TOMORROW: Unleash the Cash Flood
Posted June 11, 2026
By Enrique Abeyta
Friday's Violent Sell-Off (It Changes Nothing)
Posted June 08, 2026
By Enrique Abeyta
