
Posted April 28, 2025

By Enrique Abeyta
URGENT: A Rare “Buy Signal” Just Fired…
After weeks of stomach-churning volatility, it finally happened.
A rare technical signal — one with a 100% success rate going back to World War II — just flashed in the stock market.
It's called the Zweig Breadth Thrust. And every time it has appeared over the last 80 years, it’s been followed by a major rally over the following months.
Today, I’ll explain exactly what a Zweig Breadth Thrust is, how it works, and what it means for you.
Let’s dive in!
Zweig’s Breadth Thrust
The Breadth Thrust Indicator is a technical indicator developed by the legendary trader Martin Zweig used to determine market momentum.
The indicator is calculated by looking at the number of stocks going up (advancing) versus going down (declining) on the New York Stock Exchange.
It calculates a daily percentage and also looks at a 10-day moving average.
A high percentage means many more stocks are going up versus down; a low percentage is the opposite. The 10-day moving average helps identify the trend in this ratio.
In big selloffs like the one we have seen recently, these numbers get incredibly low.
The actual indicator is generated when the moving average goes from a low level below 40% (an oversold market) to a level above 61.5% quickly. It must happen in just a 10-day period.
This might not sound like much of a move, but it has only happened 18 times in the last 80 years.
This type of reversal in market breadth indicates that a recovery has real volume buying behind it.
How It Works
Coming off a very oversold level, it can indicate potential signals for the start of a new bull market.
It could indicate that the panic selling was overdone and now a quick recovery can begin. It can also indicate that the selling in a longer bear market has finally been exhausted.
Either way, it is an extraordinarily strong signal that we have now entered a new bull market. How strong?
Here is a post from one of my favorite strategists, Ryan Detrick of Carson Investment Research.
It has a table showing the previous 18 times this has been triggered and how the S&P 500 has performed over various periods across the next 12 months.
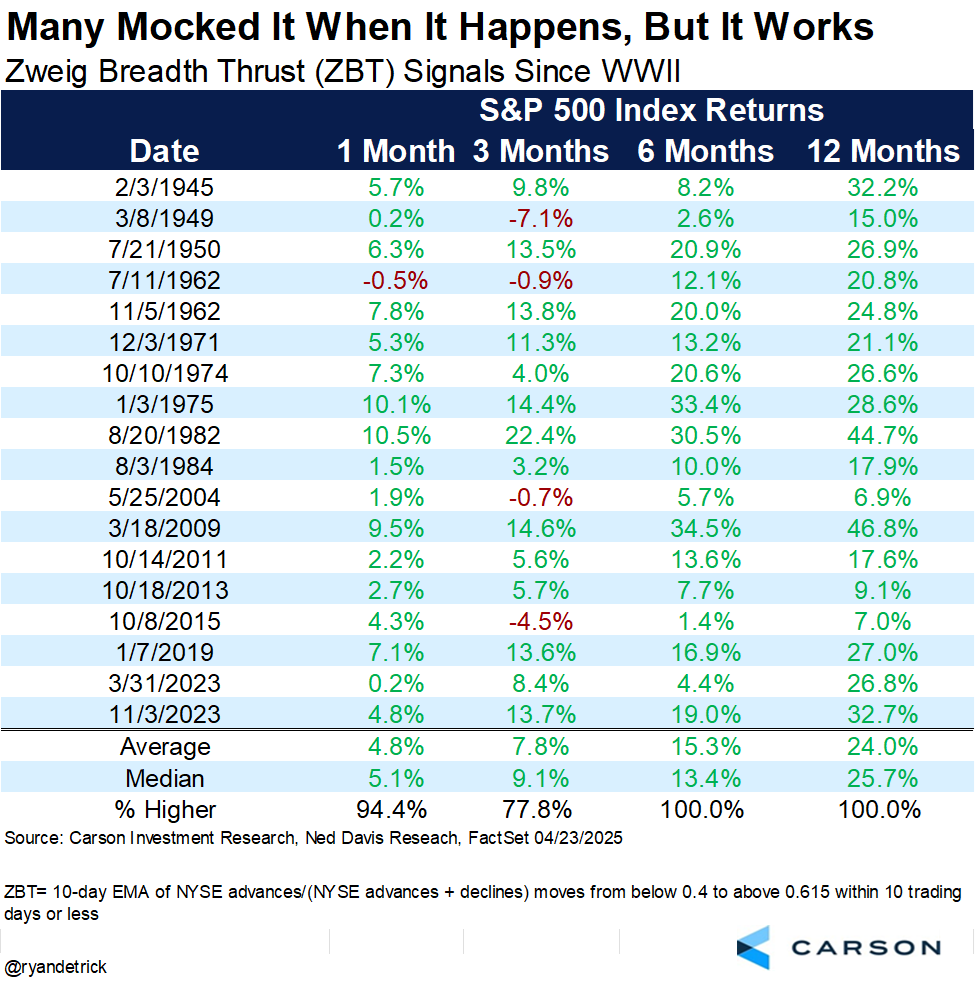
Source: Ryan Detrick
These are some amazing results!
Over one month, it has been successful almost 95% of the time. Over three months, it is less likely to be positive at 78%.
Go out for six months and a year, though, and it has worked 100% of the time.
Not only that, but the returns for the S&P 500 have been almost double the average returns over those periods.
This is one of the most powerful (and rare) signals that exists in all technical analysis!
Is it going to work again?
What It Means for You
There are no guarantees in the stock market, and certainly not in this current political environment.
But my experience over three decades of active investing has taught me to respect history and the data.
While every single selloff (and rally) seems to have different catalysts, the price action inevitably follows the same patterns.
Given the history of this indicator, I am not willing to make the bet that this time is different.
What does this mean you should be doing with your portfolio?
If you have been short, congratulations! Great call. Book your gains and move to the sidelines.
If you have been worried and are thinking about selling, it is too late. Hold on and be patient. The stock market inevitably will come back for you, and this data says it may come back sooner than you think.
And if you are now mostly in cash, I would say to continue to be patient.
A rare setup like this doesn’t come around often — and when it does, history says you want to be ready.
Volatility is still in the cards, but the bigger move is likely already in motion.
Stay patient. Stay prepared. And when the next dip comes... be ready to act.
Sign Up Today for Free!
Truth & Trends brings you market insights and trading tips you won't find anywhere else — unless you have your own personal hedge fund manager on speed dial...
Meet Enrique Abeyta, one of Wall Street’s most successful hedge fund managers. With years of experience managing billions of dollars and navigating the highs and lows of the financial markets, Enrique delivers unparalleled market insights straight to your inbox.
In Truth & Trends, Enrique shares his personal take on what’s moving the markets, revealing strategies that made him a star in the world of high finance. Whether it’s uncovering the next big trend or breaking down the hottest stocks and sectors, Enrique’s insights are sharp, actionable, and proven to work in any market condition.
Inside these daily updates, you’ll gain:
- 50 years of combined trading wisdom distilled into actionable insights.
- A behind-the-scenes look at how Wall Street pros spot opportunities and avoid pitfalls.
- Exclusive strategies that Enrique personally uses to deliver exceptional returns — no fluff, just results.
To have Truth & Trends sent directly to your inbox every weekday, just enter your email address below to join this exclusive community of informed traders.
Don’t miss your chance to learn from one of the best in the business.
Sign up now and take your trading game to the next level.

The Last Face You See
Posted July 31, 2026
By Greg Guenthner

Micron: Don't Tip the Raft!
Posted July 30, 2026
By Enrique Abeyta

Debunked: The Margin Debt "Crash Signal"
Posted July 27, 2026
By Enrique Abeyta

Buy, Sell, or Hold: Every Mag 7 Stock
Posted July 24, 2026
By Greg Guenthner

The Iran Endgame, Revisited
Posted July 23, 2026
By Enrique Abeyta