
Posted April 10, 2025

By Enrique Abeyta
Trump Be Damned! We Know Where the Market Is Going
Everyone is glued to Trump’s social media, trying to figure out the stock market based on each new post.
He announced a surprise 90-day tariff pause yesterday via Truth Social, and stocks shot up immediately on the news.
Now, I don’t know what he is going to do next. No one does.
But based on 100 years of stock market history, I guarantee you this…
While the bull market may be over, we have seen these sorts of environments before — and we know how to trade them.
We have simply entered a transition phase, which means we need to adjust to more volatile conditions.
Even when markets produce eye-popping statistics like we have never seen, they will eventually play out like patterns from the past.
Based on these patterns, I’ll show you what will happen next — and how you should trade it.
A Throwback to the COVID Crash
One of the more interesting aspects of the current selloff is the parallels to 2020 during the early stages of COVID.
Here is the chart of the S&P 500 from September 2019 to the end of 2020.
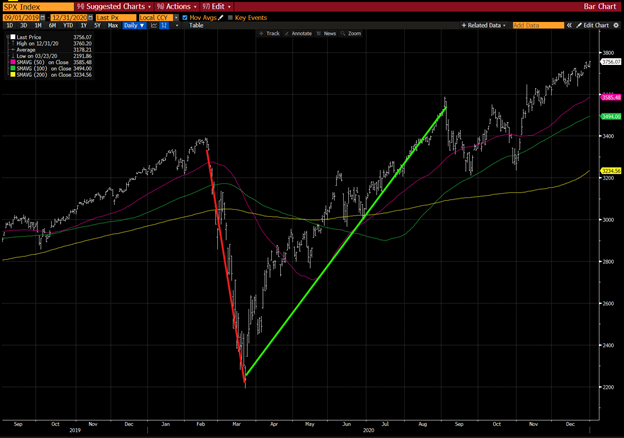
The 50-day, 100-day, and 200-day moving averages are also on this chart, along with trendlines showing the steep selloff (thick red line) and recovery (thick green line).
The similarities here are powerful.
The stock market had a good year in 2019 and rallied strongly into year-end. It spent the entire second half of the year well above the 200-day moving average.
We also began to see some speculative activity bubble up in areas like cryptocurrency and technology. Sound familiar?
After setting a new high on February 19, the stock market began to plummet with the realization that COVID was going to be a big issue.
(One fascinating note is that the most recent high in the S&P 500 was also set on that exact date, February 19.)
From there, the stock market plummeted with an incredible 34% drop in a little over a month.
Based on the chart, it looks like the stock market fell in a straight line. Here is the data showing the daily price movements over that period.
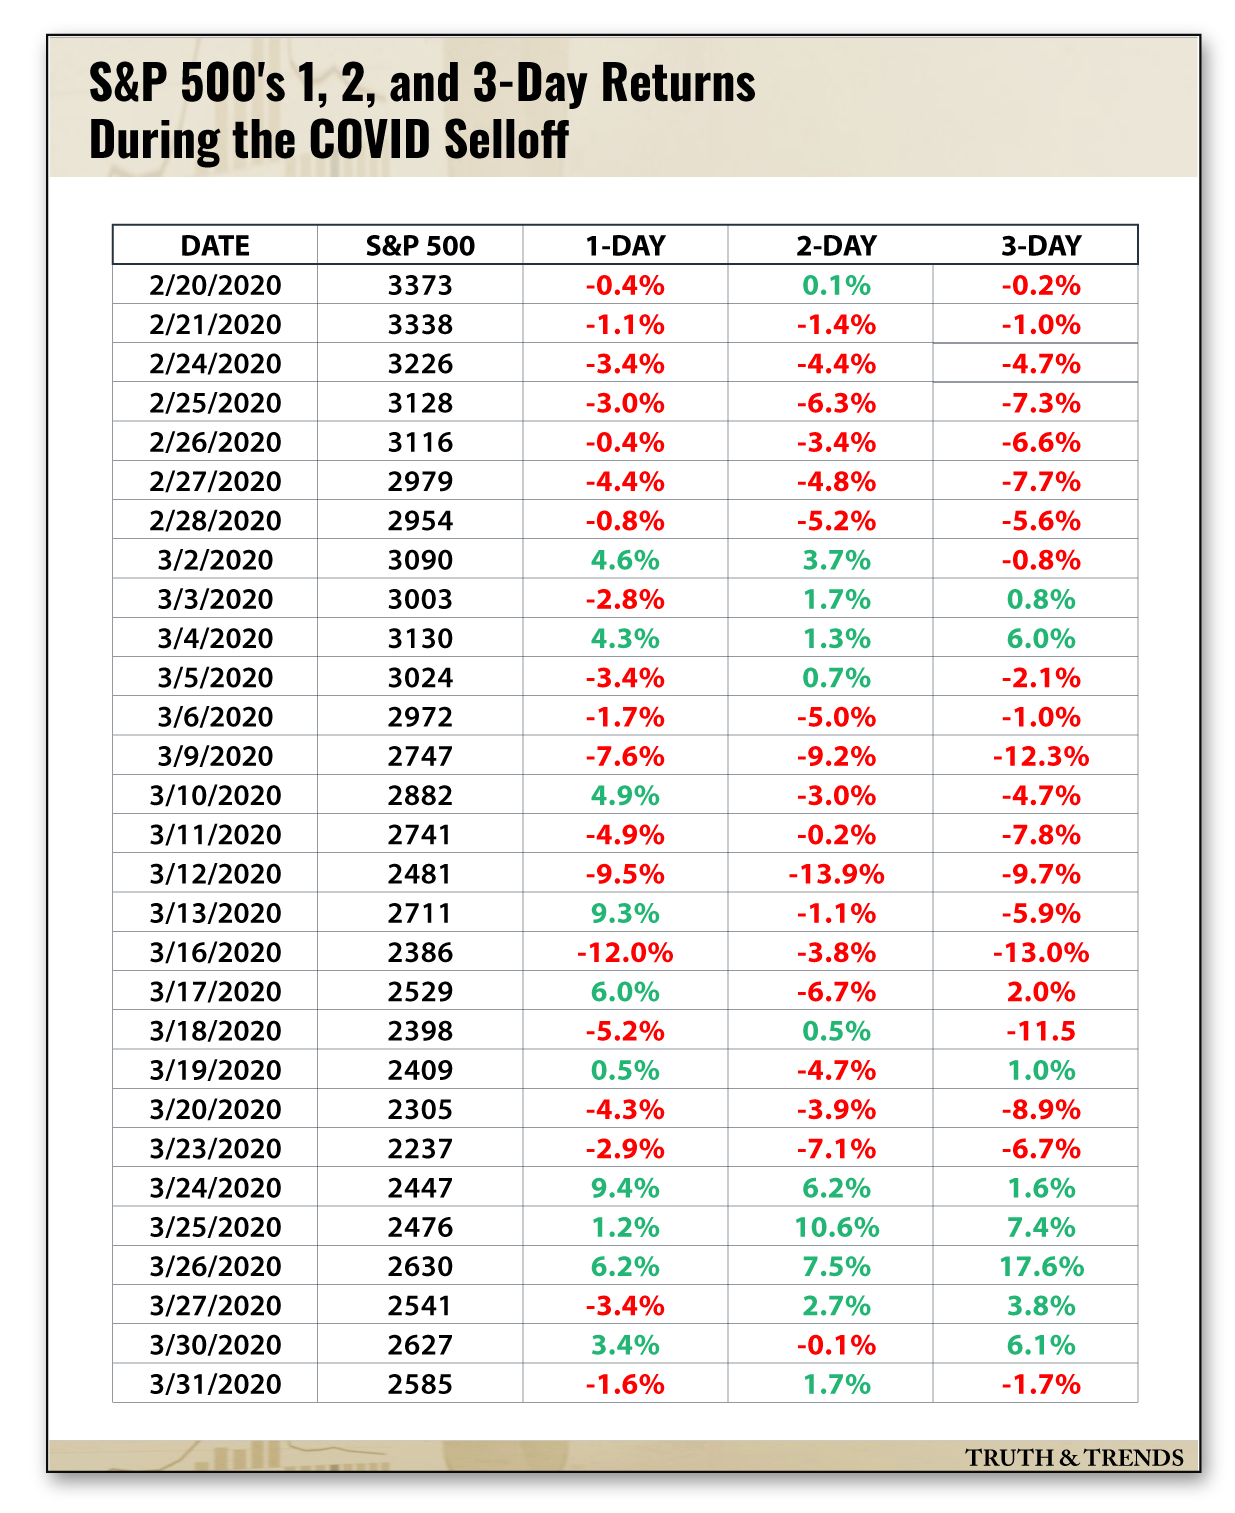
The selloff began with a steep downward move that lasted seven days and was a -12% move lower.
The drop off the back of the Trump tariff announcement lasted five days and also went -12% lower.
Back in 2020, the stock market then stabilized for a few days and retraced about +5% before sliding -9%. Then stocks saw a +5% snapback before an incredible two-day collapse of -14%.
The three trading days between March 12–16 were some of the craziest in the stock market since the Great Depression. The market averaged a double-digit move in each of those three days.
Note, though, that one of these moves was higher. And this three-day period was followed by another day higher.
This detail is interesting because when the stock market sells off, it feels like it will never go up again.
Just remember how you felt yesterday before the tariff pause! But as we saw again, stocks can still make impressive gains even in a choppy market.
In fact, the stock market’s largest single-day moves higher have all happened during these violent phases of volatility.
This time is no different, which means there will be opportunities for traders to reposition and make money in the coming weeks.
Our Updated Playbook
If you came into the selloff fully invested, then use the strength to pare down your exposure on bounces like yesterday’s.
I would NOT be a seller when the stock market goes down five days in a row, trying to miss a further move down.
If you came in with less exposure, turn this environment into an opportunity.
On the most recent Top Trades Live with my colleague Greg Guenthner, we talked about the rule of “3.5%.”
The idea is that you divide your trading portfolio into several parts, say six or eight. Any day the market is down -3.5%, you buy one of these parts. Any day it’s up +3.5%, you sell one of these parts.
This strategy would have worked in the 2020 selloff — and in every single selloff that has happened over the last 30 years.
The key to all of it is to remain nimble and be as willing to sell your quick wins as you are to buy the stock market panic.
I have no idea what Trump will do next. It’s still too early to call this a bear market. And I can’t tell you if it’s going to rain next Tuesday.
But based on a century of stock market history, I can guarantee that these types of opportunities are setting up right now.
Understand, short or long, it is easy to lose a lot of money in these market conditions.
The good news, though, is that traders with a good plan know what to do next.
Sign Up Today for Free!
Truth & Trends brings you market insights and trading tips you won't find anywhere else — unless you have your own personal hedge fund manager on speed dial...
Meet Enrique Abeyta, one of Wall Street’s most successful hedge fund managers. With years of experience managing billions of dollars and navigating the highs and lows of the financial markets, Enrique delivers unparalleled market insights straight to your inbox.
In Truth & Trends, Enrique shares his personal take on what’s moving the markets, revealing strategies that made him a star in the world of high finance. Whether it’s uncovering the next big trend or breaking down the hottest stocks and sectors, Enrique’s insights are sharp, actionable, and proven to work in any market condition.
Inside these daily updates, you’ll gain:
- 50 years of combined trading wisdom distilled into actionable insights.
- A behind-the-scenes look at how Wall Street pros spot opportunities and avoid pitfalls.
- Exclusive strategies that Enrique personally uses to deliver exceptional returns — no fluff, just results.
To have Truth & Trends sent directly to your inbox every weekday, just enter your email address below to join this exclusive community of informed traders.
Don’t miss your chance to learn from one of the best in the business.
Sign up now and take your trading game to the next level.
My Tesla Calls Went to Zero... Just as I Planned
Posted July 10, 2026
By Greg Guenthner

Mark Twain Was Right About Your Newsfeed
Posted July 09, 2026
By Enrique Abeyta

Six Months In: My 2026 Report Card
Posted July 06, 2026
By Enrique Abeyta

The S-E-T System for Finding Breakout Stocks
Posted July 03, 2026
By Greg Guenthner

6,019 Reasons to Be a Proud American
Posted July 02, 2026
By Enrique Abeyta
