
Posted November 25, 2025

By Ian Culley
The Art of the Stop Loss
Imagine buying a hot speculative growth stock.
You’re up 30% in two days.
Your mind begins to run. You start raising your profit targets. This could be the answer to your prayers.
The world is your oyster, and there’s no shortage of mignonette and horseradish. Heck, you start planning your summer vacation.
Galápagos, anyone?
Fast forward a week, and your speculative runner is barely breaking even. Another week passes, and it’s down 40%.
You’re sick to your stomach. You can’t look at your P&L…
In the blink of an eye, the world has turned into a bitter lemon, and you’re ready to bail!
Here’s the thing: it doesn’t have to be this way.
You can trade speculative growth stocks and catch explosive rallies with ease. But you must protect your capital andyour emotions along the way.
These three strategies will help you do just that…
1. Use a Key Pivot Low
A pivot low in price (or high if you’re shorting) effectively identifies where your trade no longer remains valid.
Think of it as the final turn leading to a straightaway. Short sellers lean into a particular stock only for buyers to step on the gas and blaze a trail to fresh highs.
We all want to be on that trail to fresh highs, but we can only beat that path if prices are heading in our direction. That’s where a key pivot low comes into play…
Check out the two sets of lows (marked with dark blue arrows):
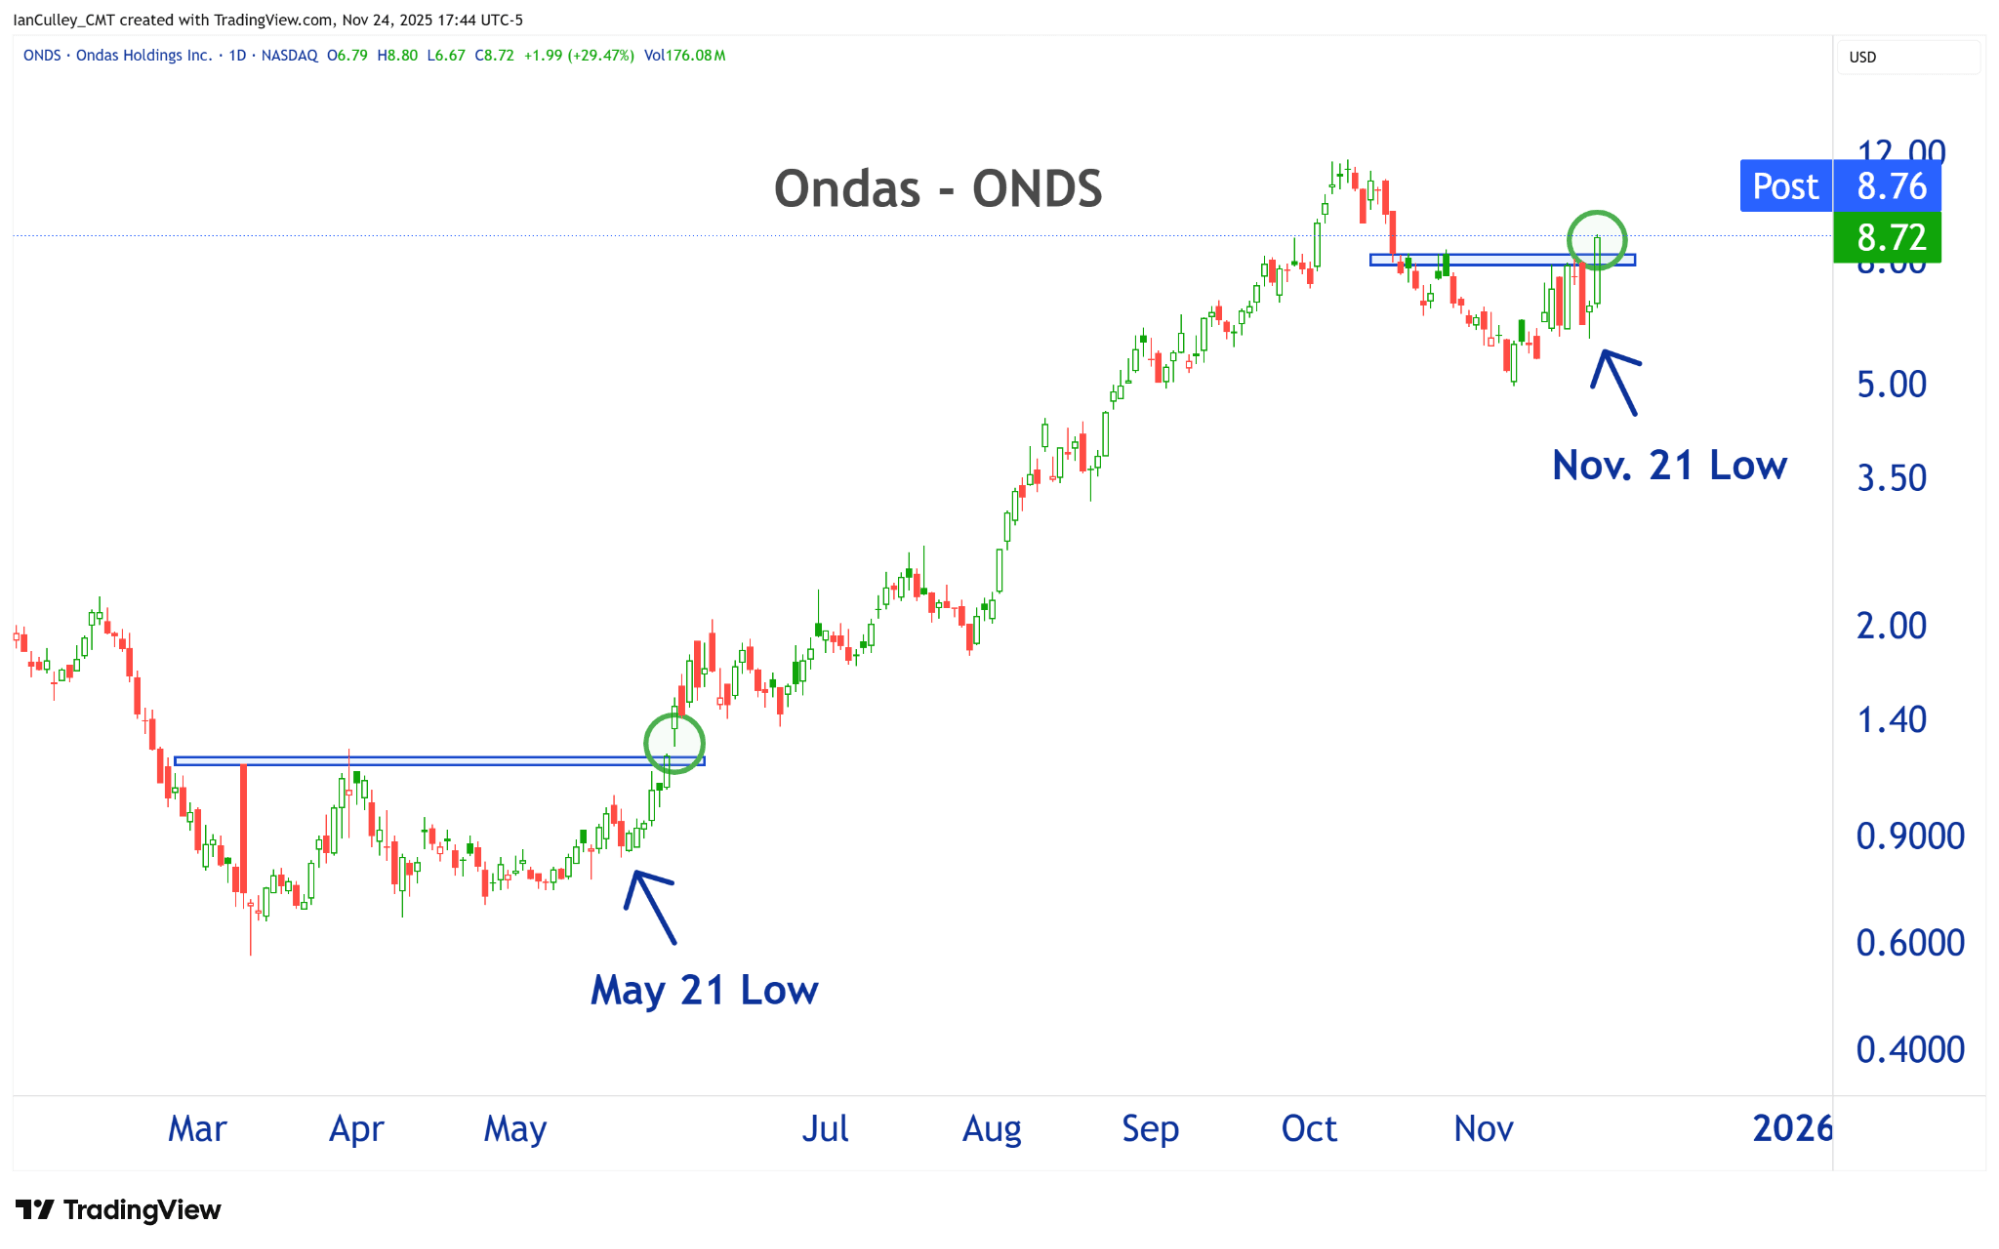
It’s simple.
Let’s say Ondas Holdings Inc. (ONDS) triggered a buy signal yesterday when it printed a five-week high. I have no desire to own ONDS if it closes below the shelf of lows formed just before the breakout, specifically, the Nov. 21 low.
Perhaps you’d prefer to move your stop slightly below the trough set earlier this month. Both work. But if you choose to move your stop to a lower inflection point on the chart, you must reduce your position size to account for the increased risk.
It all comes down to your personality and trading plan.
2. Follow the Trend With a Trailing Stop
Moving averages provide another way to protect your capital and open profits.
A moving average approximates a trend by averaging an asset’s price for a set period. Let’s use 21 days as an example, the number of trading days in a typical month.
Add up the past 21 days of price action and then divide by 21 to arrive at the average. That average moves forward each day, replacing the oldest daily price with the most recent, hence the name moving average.
For simplicity’s sake, I chose the “simple” moving average (SMA). But multiple calculations exist, such as exponential, linearly weighted, and volume-averaged weighted. Try them out and see what works best for you.
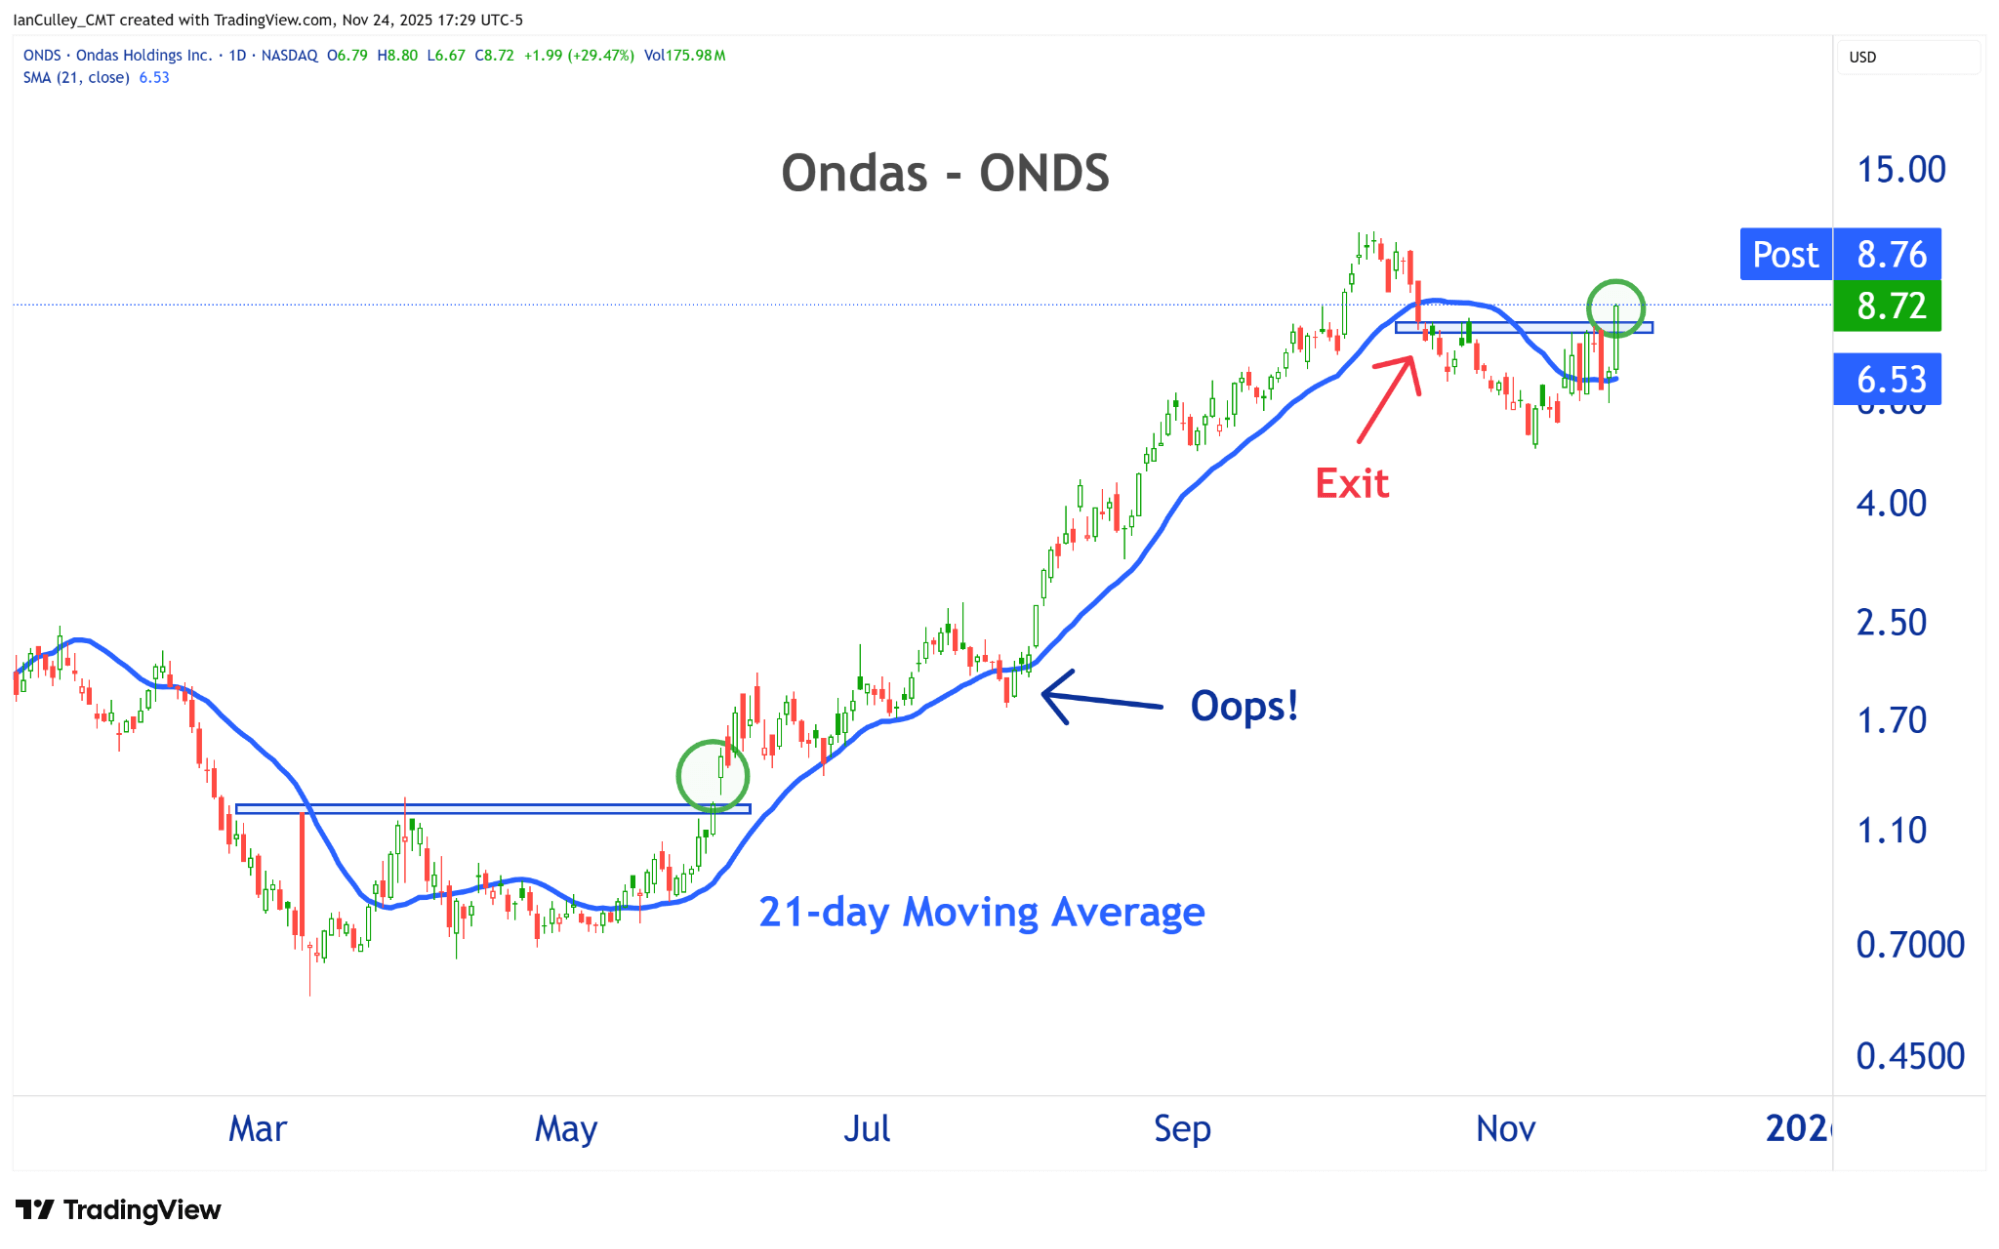
Check out the 21-day simple moving average highlighted in blue:
Once you’ve entered a trade, you want to ride it until prices undercut the SMA. I developed a 2-day rule for triggering exits.
The first daily close below the simple moving average acts as a setup day.
A daily close below the setup day triggers the stop loss.
Of course, like most aspects of trading, it’s a balancing act. You want your stop to be close enough to limit significant losses, but at the same time, you don’t want to exit a trend prematurely.
That’s why I developed the two-day rule.
The idea is to give a position room to dance around the moving average, so you can stay in a trade while avoiding a round-trip back to your entry price. Traders refer to stop losses like this as trailing stops since they trail a position.
Moving averages and trailing stops are often used in trend-following strategies. However, they also work well for mean-reverting strategies, albeit with slightly different parameters.
3. Set a Timer to Limit Losses
In the past, I would set my stop and leave it, only moving it higher to breakeven once the trade moved in my favor.
Then I realized the meat of my returns came from trades that work right away. So I started using time stops to help me cut the stragglers before they reached my initial stop level.
These stop losses are based on a predetermined period. Think of it as a timer. I usually give a trade a week to close in the green. I’m out if it doesn’t.
I can’t imagine navigating the markets without knowing when and where I’m wrong, or how to exit a trade.
Stop loss strategies, like the ones outlined above, answer those questions and save you from catastrophic losses. They keep you in the game.
Perhaps, more importantly, they help you rise above the suffering.
Sign Up Today for Free!
Truth & Trends brings you market insights and trading tips you won't find anywhere else — unless you have your own personal hedge fund manager on speed dial...
Meet Enrique Abeyta, one of Wall Street’s most successful hedge fund managers. With years of experience managing billions of dollars and navigating the highs and lows of the financial markets, Enrique delivers unparalleled market insights straight to your inbox.
In Truth & Trends, Enrique shares his personal take on what’s moving the markets, revealing strategies that made him a star in the world of high finance. Whether it’s uncovering the next big trend or breaking down the hottest stocks and sectors, Enrique’s insights are sharp, actionable, and proven to work in any market condition.
Inside these daily updates, you’ll gain:
- 50 years of combined trading wisdom distilled into actionable insights.
- A behind-the-scenes look at how Wall Street pros spot opportunities and avoid pitfalls.
- Exclusive strategies that Enrique personally uses to deliver exceptional returns — no fluff, just results.
To have Truth & Trends sent directly to your inbox every weekday, just enter your email address below to join this exclusive community of informed traders.
Don’t miss your chance to learn from one of the best in the business.
Sign up now and take your trading game to the next level.

A Crude Awakening: History Says Buy Stocks
Posted March 09, 2026
By Enrique Abeyta

Fade the End of the World
Posted March 06, 2026
By Greg Guenthner

The Dark Side of the Tape
Posted March 04, 2026
By Nick Riso

The Iran War: What’s Next for Stocks, Oil and More
Posted March 02, 2026
By Enrique Abeyta

It’s Not Just You, This Market Is Mind-Melting
Posted February 27, 2026
By Greg Guenthner
