Posted April 07, 2025

By Enrique Abeyta
Tariff 2.0: A Pattern in the Chaos
You may be ready to move on from tariffs, but the market certainly isn’t.
Last week’s tariff shocks — which sent the Nasdaq into a bear market and caused the worst one-day drop in the S&P since 2020 — are nowhere near over.
Hopefully, you took some time this weekend to unplug and reset. But I understand if you're still feeling a little rattled.
So let's take a minute today to step back and put this all in perspective. And no, I don't mean cracking open the history book and analyzing tariffs from over a century ago!
To make sense of the current moment, we only have to turn back the clock to the last time Trump sent investors into a panic with tariffs.
Trump Tariffs 1.0
Back in early 2018, Trump triggered a big selloff in the stock market after making comments at the Davos economic forum. This caused the stock market to plummet for the next few weeks.
Here is a chart of the S&P 500 during that period.
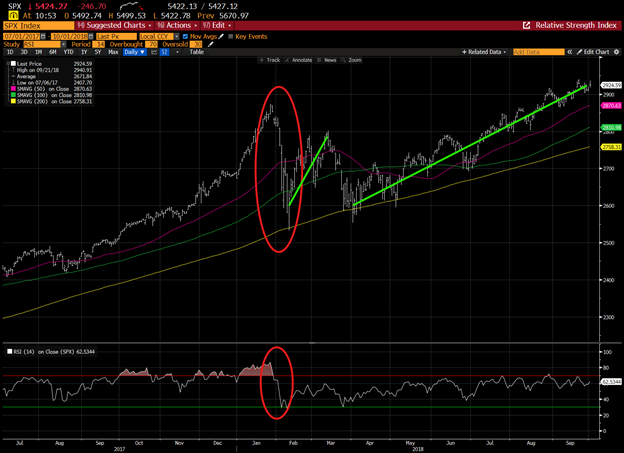
We have circled the selloff in a red circle. The S&P 500 sold off 12% in just a few days.
The bottom chart is the relative strength index (or RSI), which is a measure of investor enthusiasm.
A high number (above 70, the red line on the chart) shows investor exuberance. A low number (below 30, the green line) shows investor pessimism. Low numbers can be very good buy signals.
There are a lot of similarities between this selloff and what we are seeing today.
Back in 2018, the stock market went from a very overbought position — distance from the 50-day moving average and high RSI — to immediately being oversold.
The S&P 500 traded down to the 200-day moving average and bounced +9% and back above the 50-day and 100-day moving averages.
From there, it would retest the 200-day moving average and then trade in a very choppy manner for three months before settling down.
After that, the stock market went to new highs.
Now let’s look at the chart of the S&P 500 going into this most recent Trump tariff situation.
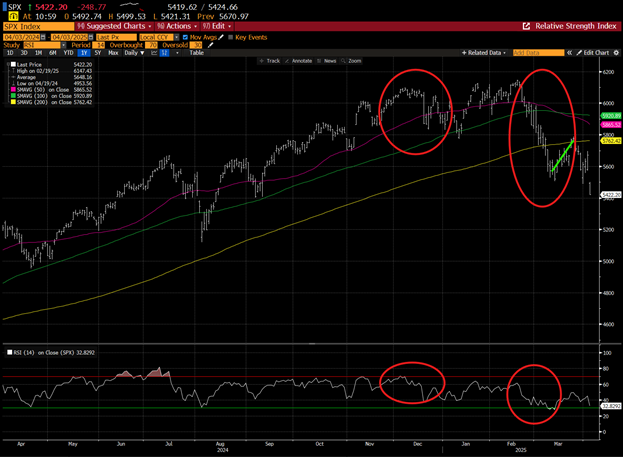
It is spaced out differently, but it looks similar.
We had a very overbought stock market in the months leading up to the tariff talk. This then resulted in a rapid selloff where the S&P 500 fell 10% and traded below the 200-day moving average.
Then there was a multi-day rally of 5% and back to that 200-day moving average.
On the charts, you can clearly see some similarities and a few key differences. This time, the situation has taken longer to develop.
The selloff has also done more damage with the S&P 500 trading below the 200-day moving average and staying below it — especially after the big recent announcement.
This all makes sense as the news is also different. The 2018 Trump tariff initiatives were a fraction of what he is trying to do now.
The stock market is accurately responding to the magnitude of the difference.
I think the stock market reaction is appropriate, but the previous period is an important point of comparison.
What happened back then was that Trump came out much more aggressive than anyone thought possible with his tariff program.
This is why the stock market sold off 12% in just a week. That is a steeper move than what just happened.
In that case, however, he rolled out his plans in the following months. And while they were still aggressive, he took actions that were less than his initial bid.
This is how he has consistently negotiated throughout his five decades in business. This style of negotiation is his trademark.
He comes in much more aggressively than anyone ever anticipated and essentially acts like the “crazy kid” in the schoolyard.
Then once everyone is on their back foot, he proceeds to hammer out deals that make sense for both parties.
It is what he did in business for decades and what he did in his last administration.
We have a ton of real-world data and experience that explains his actions.
Will This Time Be Different?
Without a doubt, this move into the tariff space is MUCH bigger than last time. To use his favorite adjective — it is “huge!”
The magnitude of the initial bid is 10 times (or more) than what he was trying to do previously. He also is going much broader than before.
In response, the stock market is beginning to reflect the larger scope. It clearly could get worse before it gets better.
In the previous period, we saw that it took three months for the market to digest the news.
The same could happen here, if not even longer.
While this will be painful for long-term investors, it will provide many short-term opportunities for traders.
The future is unknown, but the past can give us guidance — and we can use that to figure out our next move!
Sign Up Today for Free!
Truth & Trends brings you market insights and trading tips you won't find anywhere else — unless you have your own personal hedge fund manager on speed dial...
Meet Enrique Abeyta, one of Wall Street’s most successful hedge fund managers. With years of experience managing billions of dollars and navigating the highs and lows of the financial markets, Enrique delivers unparalleled market insights straight to your inbox.
In Truth & Trends, Enrique shares his personal take on what’s moving the markets, revealing strategies that made him a star in the world of high finance. Whether it’s uncovering the next big trend or breaking down the hottest stocks and sectors, Enrique’s insights are sharp, actionable, and proven to work in any market condition.
Inside these daily updates, you’ll gain:
- 50 years of combined trading wisdom distilled into actionable insights.
- A behind-the-scenes look at how Wall Street pros spot opportunities and avoid pitfalls.
- Exclusive strategies that Enrique personally uses to deliver exceptional returns — no fluff, just results.
To have Truth & Trends sent directly to your inbox every weekday, just enter your email address below to join this exclusive community of informed traders.
Don’t miss your chance to learn from one of the best in the business.
Sign up now and take your trading game to the next level.

The AI Trade's "Black Thursday"
Posted July 20, 2026
By Enrique Abeyta
3 "Stay-Away-From-Tech" Trades - TGT, INCY, SBUX
Posted July 17, 2026
By Greg Guenthner

The One Question I Ask Before Buying Any Stock
Posted July 16, 2026
By Enrique Abeyta

The Biggest IPO You Never Heard About
Posted July 13, 2026
By Enrique Abeyta
My Tesla Calls Went to Zero... Just as I Planned
Posted July 10, 2026
By Greg Guenthner