
Posted April 10, 2026

By Greg Guenthner
Quick 5-Minute Masterclass on Finding Breakout Stocks
Most people who talk about markets on the internet have never managed real money through a real drawdown.
They haven’t had to sit in front of a losing trade, hold their conviction, and let the chart tell them when to exit.
And they haven’t built a system disciplined enough to produce consistent results across hundreds of trades over time.
But I have.
As a Chartered Market Technician (CMT), I’ve focused on reading charts for more than two decades.
My approach is built on a repeatable, rules-based process grounded in price, volume, and pattern recognition — not headlines or macro predictions.
It’s the same framework I apply every day in my Trading Desk portfolio that I started with $40,000 in 2023.
That same trading portfolio is now worth over $400,000, with an average gain of 18% and an average hold time of just a few weeks.
Today, I want to pull back the curtain and show you exactly how I read charts to find the best setups to trade.
And I’ll even give you three specific stocks that I like right now based on their charts. Let’s dive in.
The S-E-T Framework: Screen, Evaluate, Trigger
My entire process for finding high-probability, asymmetric trades boils down to three regimented steps.
I call it the “S-E-T Framework.”
It’s simple enough to remember, yet rigorous enough to filter a universe of 10,000 stocks down to just three actionable trades.
Step 1: Screen (Narrow the Field)
The biggest hurdle for any trader is scale.
There are simply too many stocks to look at manually. The goal of a stock screener is not to automatically spit out the perfect trade, but rather to cut the chaos down to a manageable watchlist.
I use the screener on Finviz.com. My initial screen is incredibly simple, utilizing just two parameters:
- Market Cap over $10 Billion: I filter out small, illiquid companies because I want stocks with heavy institutional volume that also have liquid options markets.
- 50-Day Highs: I look for stocks that are right at (or just about to hit) new 50-day highs. This ensures I am only looking at stocks that are already exhibiting strength and moving in an established uptrend.
This basic screen typically takes the massive stock universe and narrows it down to about 117 charts to review in real-time.
Step 2: Evaluate (Cut the Losers)
With a manageable list of roughly 100 charts, the elimination process begins.
I first sort by sector, immediately tossing out entire categories of stocks I’m not interested in trading because they don’t fit my system's specific growth profile.
Next, I hover over the remaining tickers to quickly view their charts, tossing out the "ugly" ones. An ugly chart is one characterized by volatile whipsaws and chaotic price action.
Instead, I’m hunting for orderly charts: stocks that are consolidating, moving sideways, and resting near important price levels after a period of strength.
Step 3: Trigger (Know When to Pull It)
Finding a good stock is only half the battle.
In short-term trading, your timing matters more than anything else. If you buy too early, you risk sitting through a drawdown; if you buy too late, you miss the meat of the move.
I look for one of two specific entry signals:
- A Breakout: The stock pushes convincingly above a key resistance level where sellers previously held the stock down.
- A Meaningful Bounce: The stock pulls back to a tested support level and immediately bounces, proving that buyers are actively stepping in at that specific price.
The ultimate discipline in this step is to ignore the news cycle.
Price always happens first, and the news happens second. If a stock is breaking out cleanly on the chart, the positive fundamental news will eventually surface to explain the move.
The 3 Stocks I Like Right Now
Applying the S-E-T Framework, I’ve identified three specific large-cap stocks that are flashing excellent technical setups.
1. Garmin (GRMN)
Garmin is an incredible example of how a violent selloff can actually create a highly favorable chart setup.
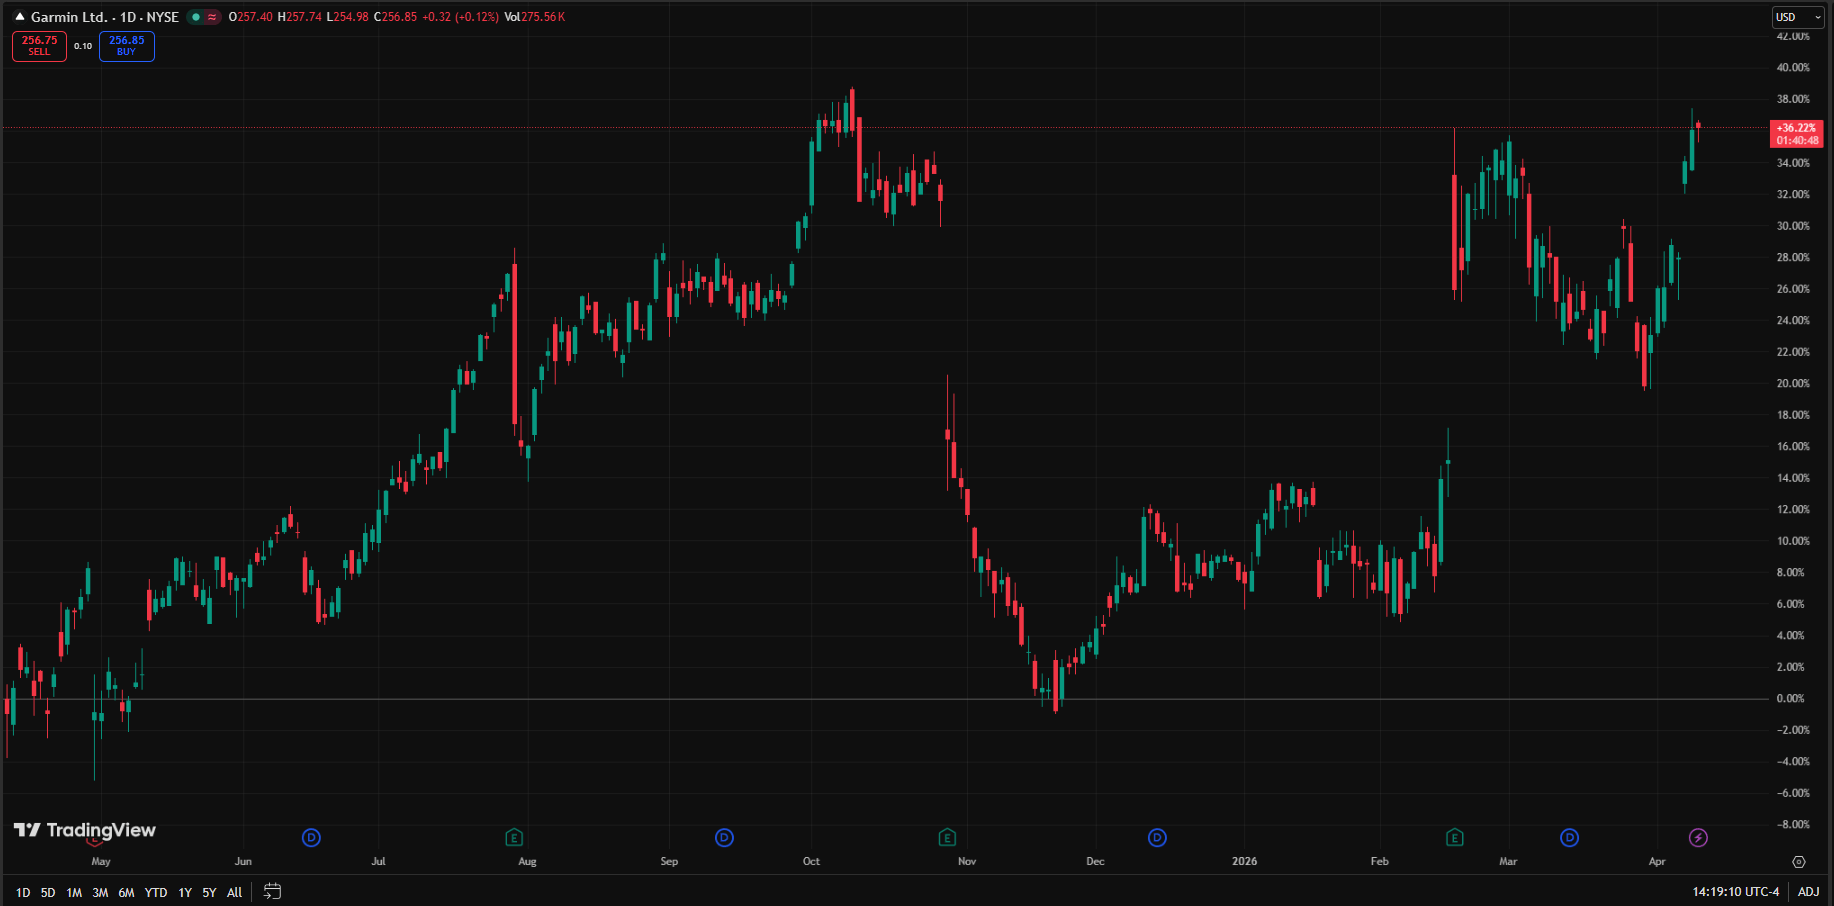
The stock had been in a longer-term uptrend before tagging multi-year highs near $260 in October of 2025. Suddenly, it suffered a massive gap down on a poorly received earnings report, waterfalling all the way down to $187.
While that sounds terrible fundamentally, technically, it served to shake out all the weak hands.
The shareholders who bought at the top and panicked are now gone. Since hitting that low, the chart has become highly constructive. It put in a higher low around $187, and then another higher low near $230 before gapping back up on a strong earnings report in February.
The Setup: Garmin is now pushing back above the $255 swing highs and approaching that critical October 2025 high.
The people who bought at the bottom are happy, and if the stock can clear $260, there will be virtually no sellers left sitting on losses. I love this stock for a short-term trade on a clean breakout close above $260.
2. Netflix (NFLX)
Netflix represents a classic recovery setup emerging from a brutal, prolonged downtrend.
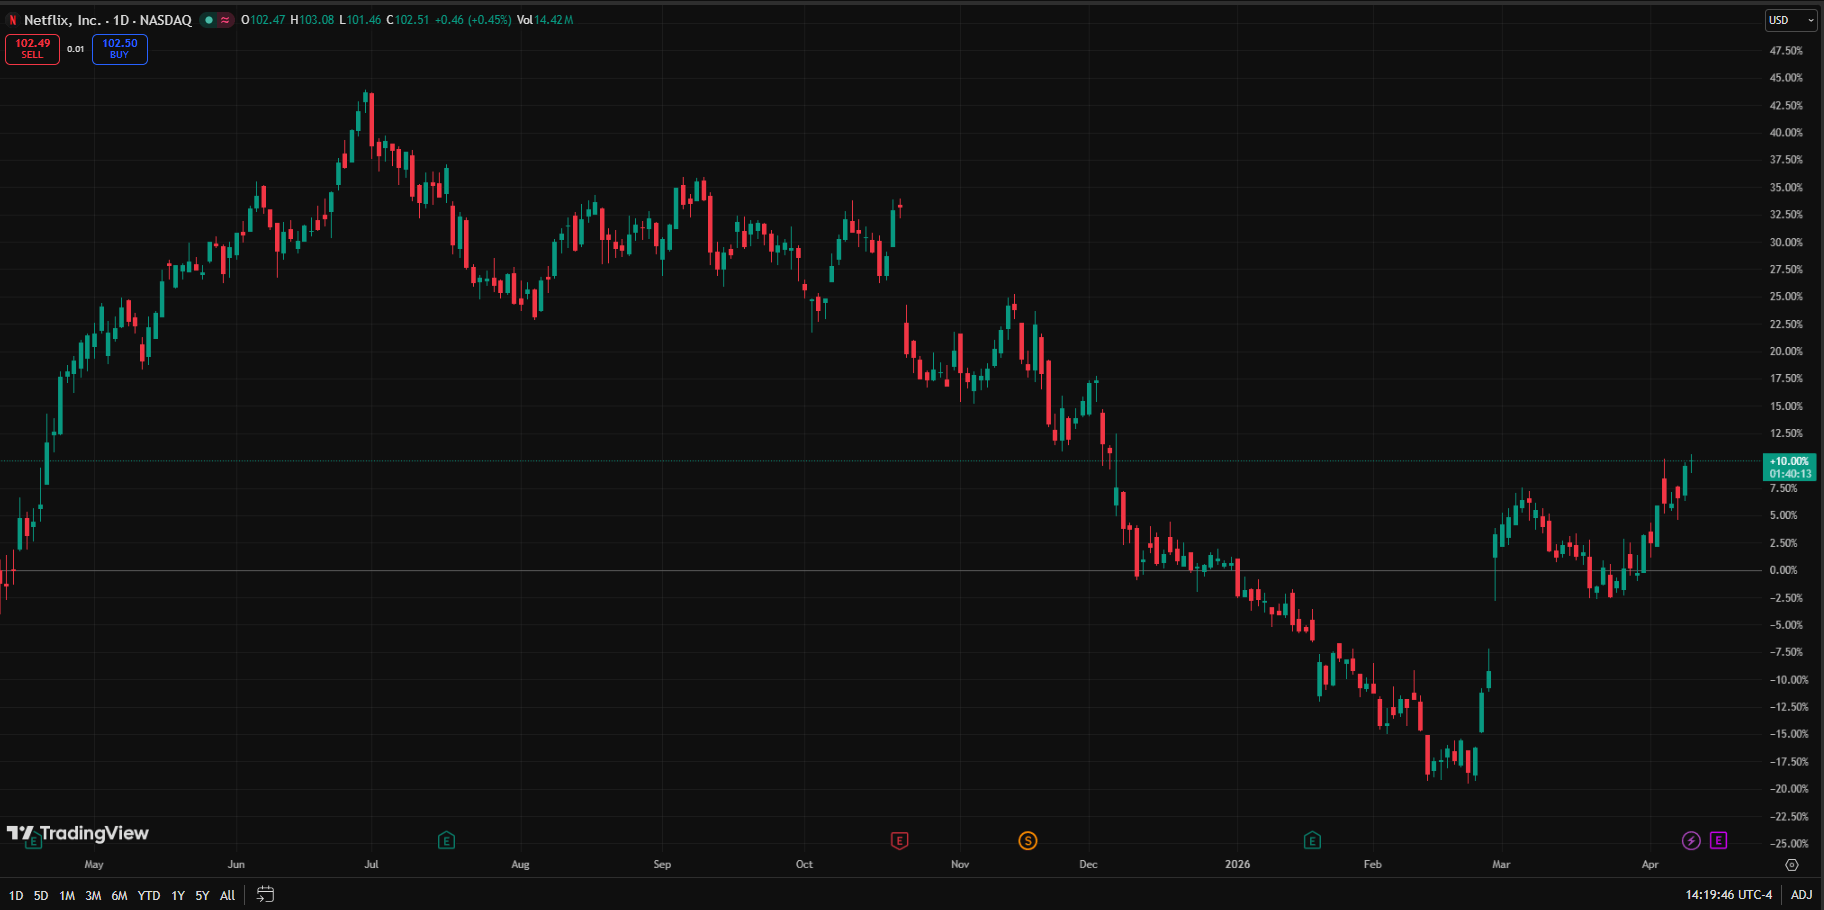
The stock peaked back in July of 2025 and basically went straight down for months. However, the character of the chart shifted dramatically in late February when it started gapping higher and picking up serious strength.
After a massive short-term run, it got slightly overbought and bled off some gains.
Crucially, however, buyers aggressively stepped in right at $90, refusing to let the stock close its previous gap. It has since turned higher and broken above the magic $100 number.
Don’t underestimate round numbers. Investors and traders naturally anchor to them, making $100 a massive psychological support/resistance zone.
The Setup: Netflix previously attempted to break $100 on March 4 and failed.
Now that it has successfully pushed through, it has a massive amount of room to make up from its long fall. The momentum is shifting from sellers to buyers. My targets $115 to $120 in short order.
The catch is that Netflix reports earnings next Thursday. Earnings introduce an unpredictable, binary catalyst that I prefer to avoid when trading pure technical setups.
3. Nvidia (NVDA)
Nvidia was arguably the hottest stock on the market until a year ago. When it abruptly went sideways, everyone seemingly stopped talking about it.
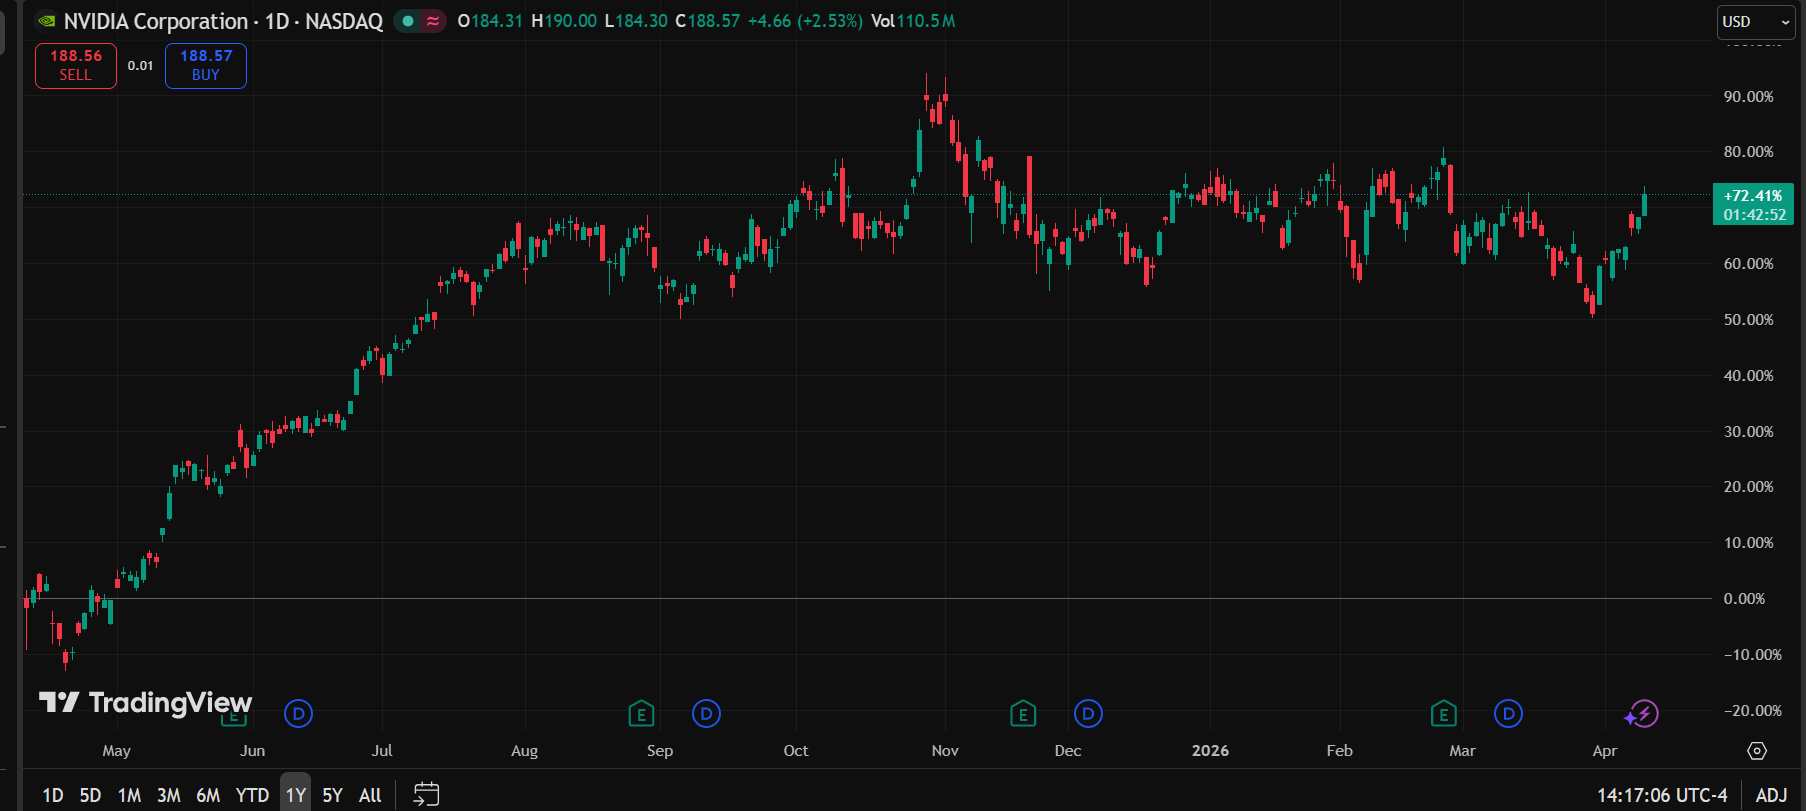
While the broader semiconductor sector (tracked by the SMH ETF) has been making new all-time highs, Nvidia has been trapped in a massive consolidation base since August of 2025.
This long period of going nowhere is exactly what catches a CMT's eye.
The AI hardware story is not going away, and Nvidia has spent the last eight months quietly absorbing sellers. It recently broke above a series of swing highs established at the end of March and is currently squeezing higher.
The Setup: Nvidia has a major shelf of overhead resistance right around the $195 to $200 mark.
Every time the stock has approached $200 over the last several months, it has encountered heavy selling pressure.
If NVDA can break substantially above that $200 level, it will enter a zone where no one is trying to sell. Once the sellers are gone, only buyers remain.
I believe a break here sends the stock to new highs in short order, and with earnings not scheduled until the end of May, the stock has plenty of runway to move.
Sign Up Today for Free!
Truth & Trends brings you market insights and trading tips you won't find anywhere else — unless you have your own personal hedge fund manager on speed dial...
Meet Enrique Abeyta, one of Wall Street’s most successful hedge fund managers. With years of experience managing billions of dollars and navigating the highs and lows of the financial markets, Enrique delivers unparalleled market insights straight to your inbox.
In Truth & Trends, Enrique shares his personal take on what’s moving the markets, revealing strategies that made him a star in the world of high finance. Whether it’s uncovering the next big trend or breaking down the hottest stocks and sectors, Enrique’s insights are sharp, actionable, and proven to work in any market condition.
Inside these daily updates, you’ll gain:
- 50 years of combined trading wisdom distilled into actionable insights.
- A behind-the-scenes look at how Wall Street pros spot opportunities and avoid pitfalls.
- Exclusive strategies that Enrique personally uses to deliver exceptional returns — no fluff, just results.
To have Truth & Trends sent directly to your inbox every weekday, just enter your email address below to join this exclusive community of informed traders.
Don’t miss your chance to learn from one of the best in the business.
Sign up now and take your trading game to the next level.

Get Ready for $40 Oil
Posted June 18, 2026
By Enrique Abeyta

The Melt-Up Case Makes Itself
Posted June 15, 2026
By Enrique Abeyta

The SpaceX Hangover Trade
Posted June 12, 2026
By Greg Guenthner

TOMORROW: Unleash the Cash Flood
Posted June 11, 2026
By Enrique Abeyta
Friday's Violent Sell-Off (It Changes Nothing)
Posted June 08, 2026
By Enrique Abeyta
