Posted August 24, 2025

By Ian Culley
Name That Chart
Reading a stock chart is a skill that many everyday investors struggle to grasp.
Even those who analyze charts for a living can let basic emotions like fear, greed, or bias toward a familiar name cloud their judgment.
So today, I want to play a game...
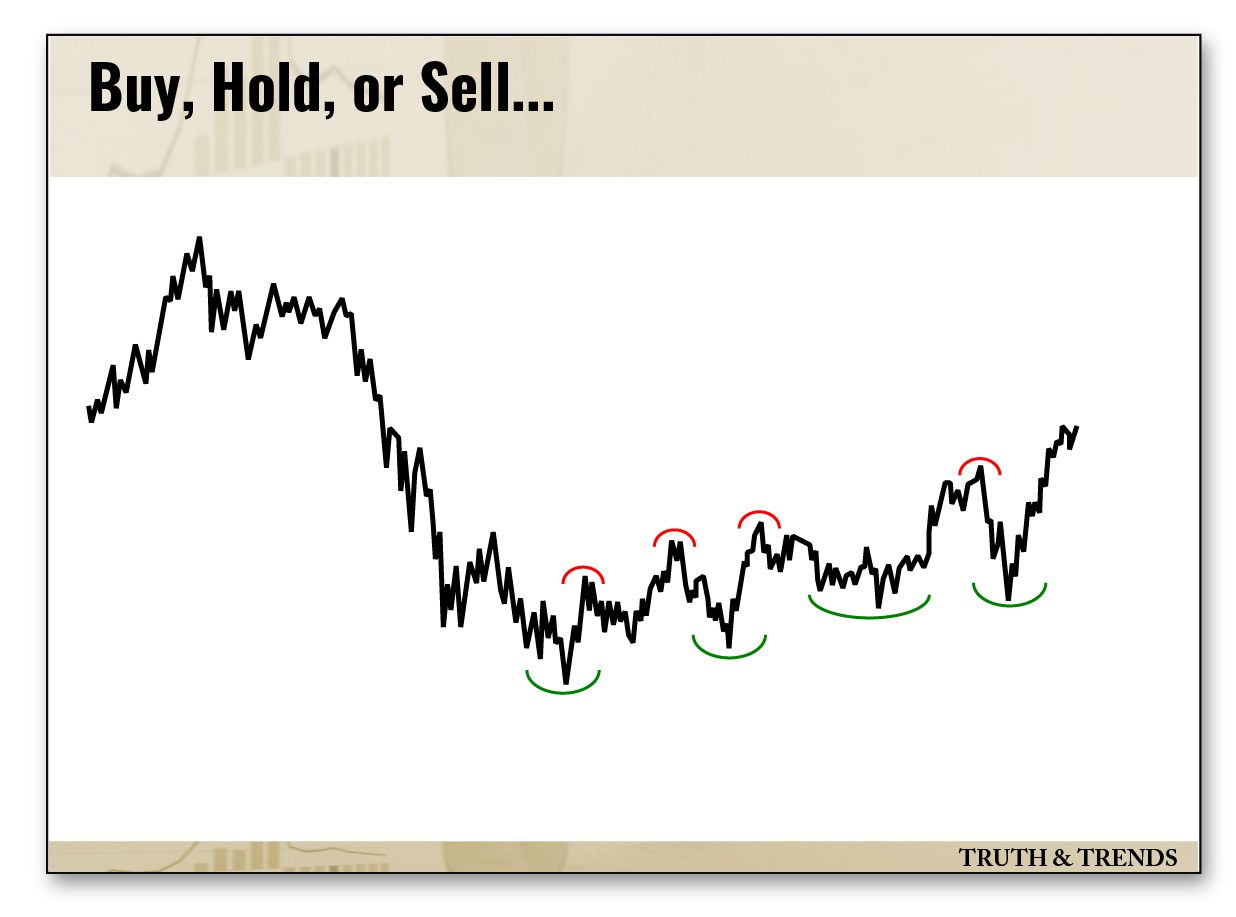
I’m going to show you a handful of charts with no labels. No ticker, no price, nothing... just the trend.
I'll also tell you whether it looks like a buy, a sell, or a hold — based only on what's in the chart.
After the verdict is in, I'll pull back the curtain and reveal what exactly we just looked at.
This exercise strips away the noise and forces us to focus only on what matters: the price action.
It'll help train your eye and open your mind to opportunities you might normally overlook.
Round 1
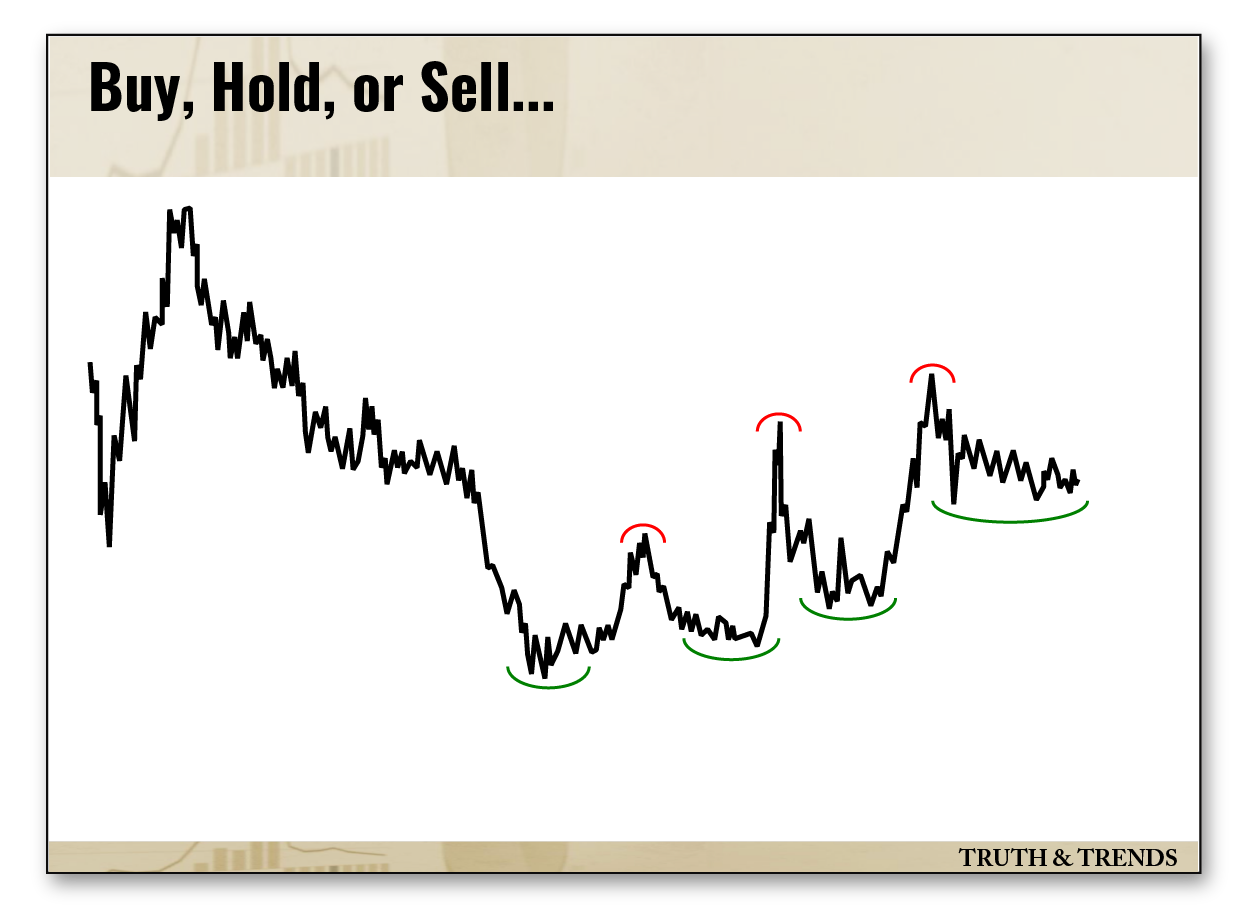
Up first, we have a steep selloff that’s followed by a series of higher highs and higher lows, the definition of an uptrend. And you’ll notice that trend straight away.
The chart below tells me that the bulls are carving out a tradeable low, and it’s gaining energy for the next explosive rally.
Now, the bulls may have to wait if price slices through that shelf of former lows, but that doesn’t bother me one bit.
I’ll tell you right now that I’m buying this uptrend.
I’ll know I’m wrong if it takes out the recent lows, which aren’t far away. But until then, the trend is your friend.
Now, what exactly are we looking at?
The chart above is the China ETF (FXI) vs. the S&P 500 (SPY). Before you stop reading, please hear me out…
I’m not buying China and selling the U.S. Instead, the chart simply suggests that Chinese stocks are trending higher at a faster rate than the S&P 500.
In no way is the rising black line bearish for U.S. stocks; it’s only a comparison.
Remember, Chinese equities have been awful for years. They were left out of the global post-pandemic melt-up. (Probably because they locked all their citizens indoors.)
In a way, Chinese stocks are due for their day in the sun. And if you recall, China and other emerging markets kept pace with gold’s all-time highs during the last commodity bull run.
So while you certainly don’t have to like China, keep in mind the emerging market giant is snapping back with force, something investors haven’t dealt with in years.
And more importantly, the Chinese market’s newfound strength bodes well for the broader emerging market space.
On to the next chart.
Round 2
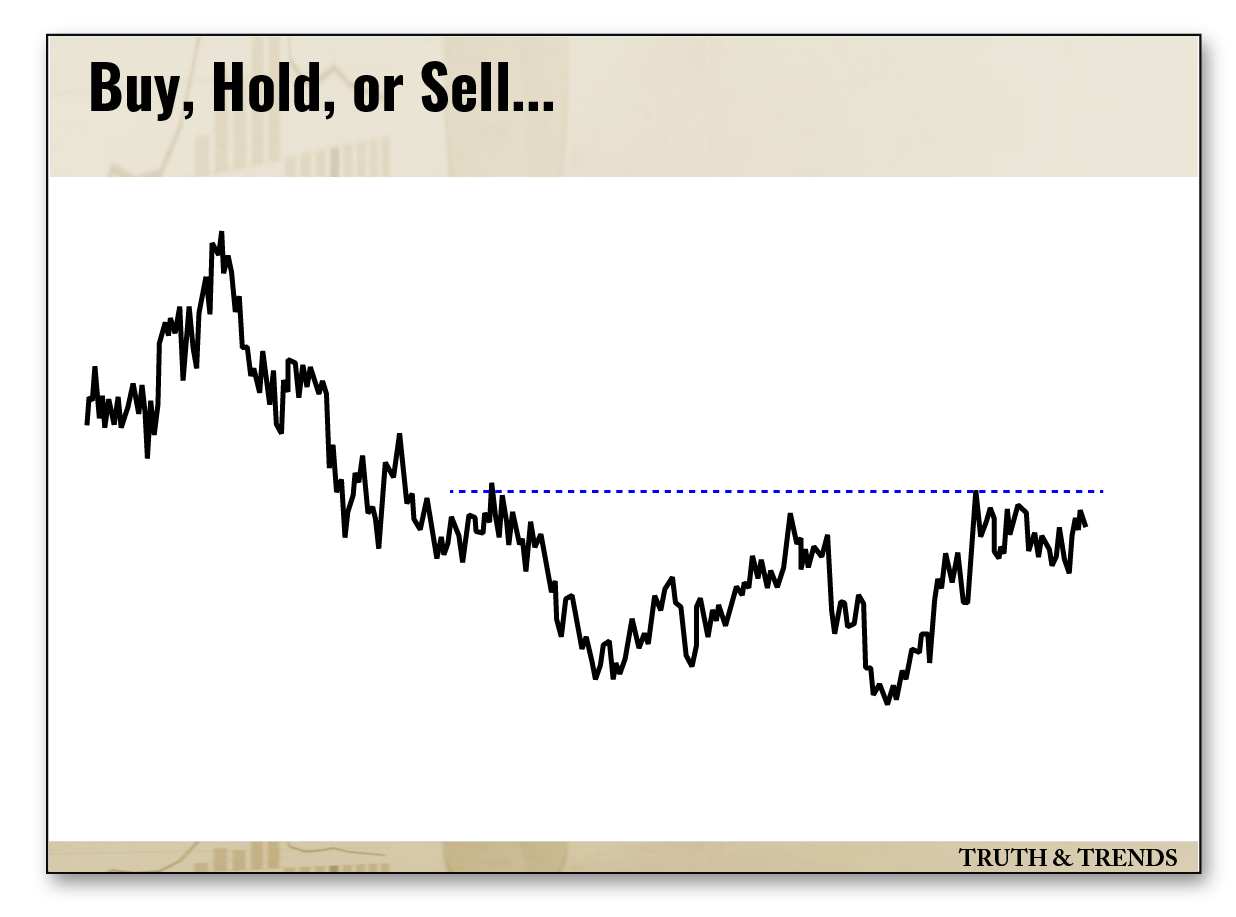
In the chart below, I see a big base breakout and a rip-roaring rally. Perhaps the rally is a bit extended, but that’s what strong rallies do.
For investors who caught the breakout, this looks like a hold. Those who missed it should look for a reasonable pullback or a buy-the-dip opportunity to get long.
So what is it? We’re looking at the Vietnam ETF (VNM).
Now, I’m not trying to pull a fast one on you. I’m sure you’ve noticed the theme of emerging markets.
I’ve been talking about EM countries, specifically Vietnam, for months.
Nvidia CEO Jensen Huang recently opened a new R&D center in Vietnam. And if you own a pair of athletic shoes, the odds are they were made in Vietnam.
The stars aligned earlier this year, so I decided to take a stab at VNM earlier in the spring. While it has been a wild ride, it’s certainly paid well.
The Vietnam ETF is up 53% year-to-date, outpacing SPY, QQQ, and NVDA.
Round 3
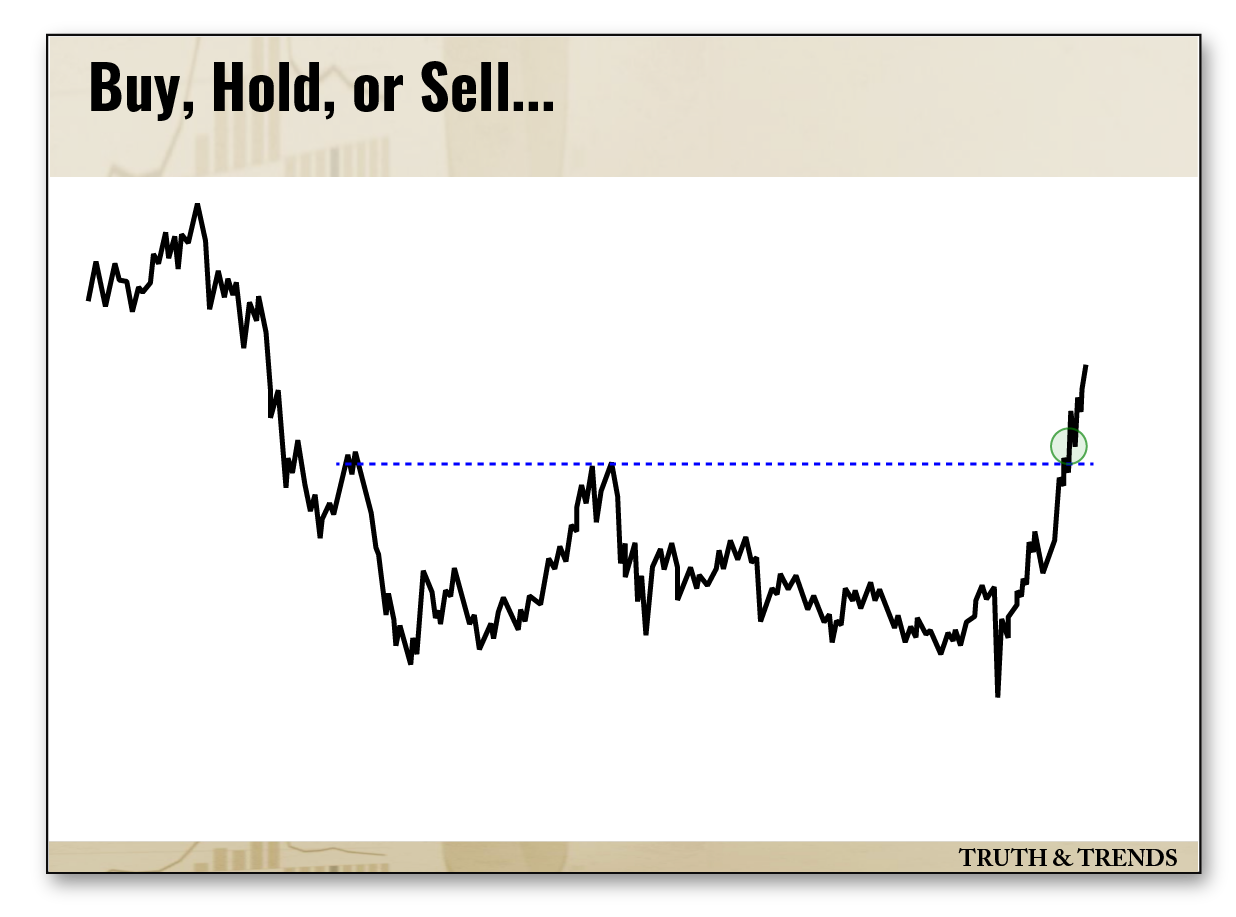
The big base in this next chart suggests buyers are accumulating shares following a selloff.
But unlike the first two, it’s difficult to point to a definitive bearish-to-bullish reversal.
I think this base will eventually resolve higher.
But experience has taught me to avoid range-bound markets like the plague, so I’ll wait on the sidelines until an upside breakout materializes.
So, what ticker am I adding to my breakout watchlist? The South Africa ETF (EZA) vs. the S&P 500.
Last month, Bloomberg reported that South African shares were outperforming other emerging markets and the U.S. equity benchmark.
They also said this is likely to continue through the end of the year, citing a weaker dollar and precious metals demand.
In April, I wrote to you about the South African platinum miner Sibanye Stillwater (SBSW) for these same reasons.
The stock has more than doubled this year, besting even the most popular quantum computing names.
Apparently, the Street is coming to the same conclusion, and it’s informing their decision-making process.
Bonus Round
Before we wrap up, I have one last chart for you. It looks similar to the first chart comparing Chinese and American stocks.
The trend appears to have reversed in favor of the bulls, and they’re charging their way back toward those former highs.
I want to own this chart, just like the rest.
Now, the fourth and final chart is…
The ARK Innovation ETF (ARKK), Auntie Cathie’s stable of hopes and dreams. Finally, a familiar face!
There’s a good chance you own ARKK or at least have exposure to the same innovative tech stocks that the fund holds.
Not only do I own a couple of these growth names, but I also use the ETF to gauge investors’ appetite for risk.
ARKK’s May rally was my first indication that the bull market was back. Characteristically, these tech-growth names have been ripping since the Q2 market bottom.
However, VNM, EZA, and SBSW have all posted better returns since the beginning of the year.
To be clear, I’m not advocating that you dump SPY and replace it with emerging markets and South African platinum miners.
The U.S. stock market will continue to deliver generous gains. Nvidia, ARKK, and the tech-growth theme du jour will do the same.
My only hope is to expose overlooked and unloved market areas that are posting the best returns right now and will continue to do so in the coming 5-10 years.
Now that our game for today is over, I want to hear from you.
Are you buying these charts, or am I missing something?
Did looking at the trends without knowing the tickers make you think differently about any of these sectors?
I’d love to hear your take. So please, drop me a line and let me know what you think.
Sign Up Today for Free!
Truth & Trends brings you market insights and trading tips you won't find anywhere else — unless you have your own personal hedge fund manager on speed dial...
Meet Enrique Abeyta, one of Wall Street’s most successful hedge fund managers. With years of experience managing billions of dollars and navigating the highs and lows of the financial markets, Enrique delivers unparalleled market insights straight to your inbox.
In Truth & Trends, Enrique shares his personal take on what’s moving the markets, revealing strategies that made him a star in the world of high finance. Whether it’s uncovering the next big trend or breaking down the hottest stocks and sectors, Enrique’s insights are sharp, actionable, and proven to work in any market condition.
Inside these daily updates, you’ll gain:
- 50 years of combined trading wisdom distilled into actionable insights.
- A behind-the-scenes look at how Wall Street pros spot opportunities and avoid pitfalls.
- Exclusive strategies that Enrique personally uses to deliver exceptional returns — no fluff, just results.
To have Truth & Trends sent directly to your inbox every weekday, just enter your email address below to join this exclusive community of informed traders.
Don’t miss your chance to learn from one of the best in the business.
Sign up now and take your trading game to the next level.

The AI Trade's "Black Thursday"
Posted July 20, 2026
By Enrique Abeyta
3 "Stay-Away-From-Tech" Trades - TGT, INCY, SBUX
Posted July 17, 2026
By Greg Guenthner

The One Question I Ask Before Buying Any Stock
Posted July 16, 2026
By Enrique Abeyta

The Biggest IPO You Never Heard About
Posted July 13, 2026
By Enrique Abeyta
My Tesla Calls Went to Zero... Just as I Planned
Posted July 10, 2026
By Greg Guenthner