
Posted March 13, 2025

By Enrique Abeyta
Market Rally Incoming!!! Buy Before March 15th…
Beware the Ides of March…
This is the famous line from William Shakespeare’s seminal play “Julius Caesar.”
If you don’t know, the “Ides of March” is simply the middle of the month, or March 15.
The date became infamous as the day Caesar was assassinated, marking a major turning point in the Roman Empire.
Fast forward to today, and the Ides of March often marks another critical inflection point…
The middle of March is usually when the tough seasonality of February turns around for the stock market.
Here is a great chart from one of my favorite analysts, Ryan Detrick of Carson Investment Research.
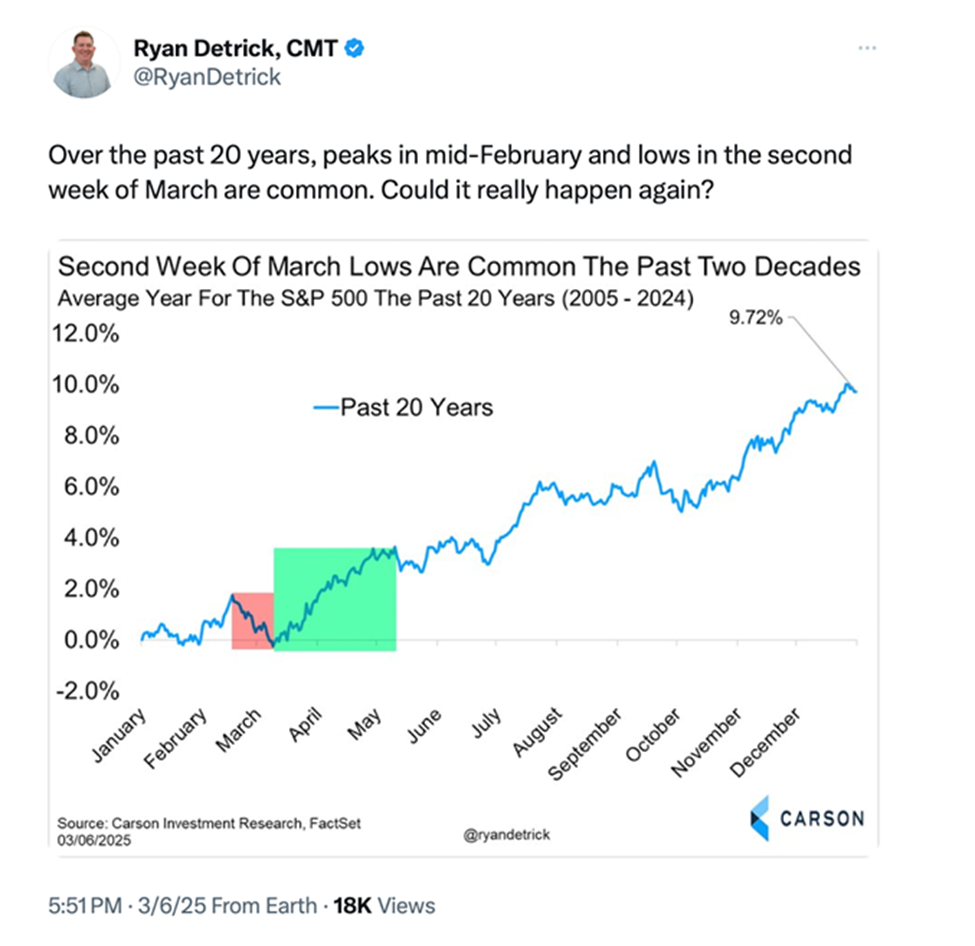
Source: @RyanDetrick
You can see that over the last two decades, the middle of March has been when the stock market usually bottoms for the first half of the year.
Do I think we are setting up for a similar situation right now? I do.
In fact, I think we are seeing one of the three best tactical buying opportunities in the last three years (the other two being October 2023 and August 2024).
Here are some points to consider…
1. Global Stock Market Strength
While the U.S. is the largest stock market out there (and the one we all care about most), there are a lot of other stock markets out there.
Here is a table from Creative Planning’s Charlie Bilello showing the year-to-date performance of global stock markets.
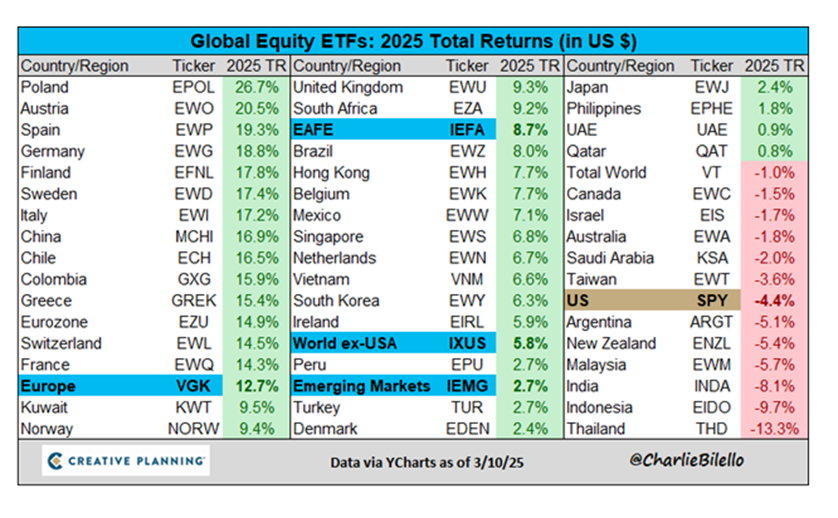
Source: @charliebilello
A pessimist will look at the U.S. markets being down 4% and dramatically underperforming most global stock indices.
An objective observer would point out that most stock markets are up — and up nicely.
This is not how a bear market starts.
If the U.S. is really going into a recession, the other countries will follow. Their stock markets would be reflecting this outcome.
2. Technical Divergences
In technical analysis, they talk about divergences. This is when one set of data does not necessarily back up another set of data.
Often when the stock market hits its highs or lows, we see divergences in some of the underlying metrics.
One of those metrics is the level of the CBOE Volatility Index (or VIX). This is considered a measure of fear in the stock market.
The higher it goes, the more panic in the markets. Here is a recent X post from technical analyst David Cox.
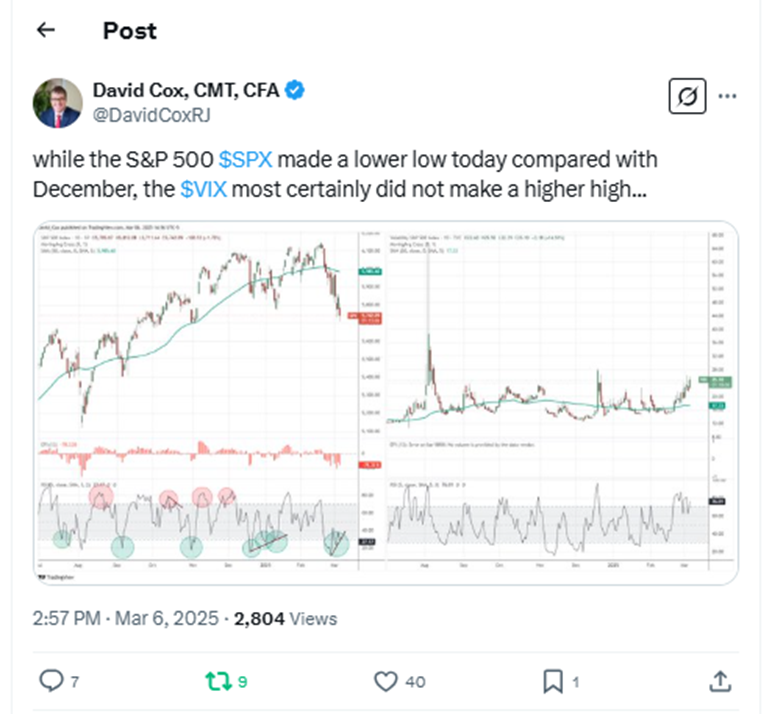
Source: @DavidCoxRJ
He points out that while the S&P 500 has hit new lows, the VIX has not hit new highs. We often see this occur at stock market bottoms.
Another divergence can be to look at the performance of the equal-weighted indices versus the market capitalization-weighted ones.
As you may know, the S&P 500 is market capitalization-weighted, so the major technology stocks play an outsized role.
Below is another table from Charlie Bilello showing the performance of the S&P 500, the Magnificent Seven, and the equal-weighted version of the S&P 500.
This is where each stock is 1/500th of the index and is a better measure of stock market health.
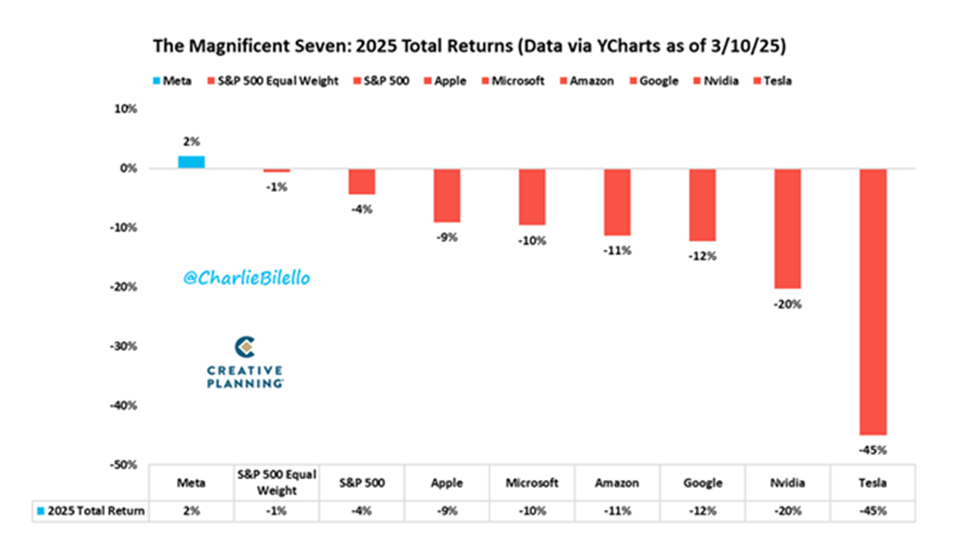
Source: @charliebilello
The carnage in the big technology stocks is obvious.
But you can also see that the equal-weighted S&P 500 is nicely outperforming the regular S&P 500 — and outperforming the technology names by a lot.
This tells us that the average stock is doing BETTER than the leaders from last year. This is a good sign of the stock market health.
3. Negative Sentiment
Another group of powerful technical indicators is sentiment indicators. These are used to understand the optimism or pessimism of stock market participants.
They can be powerful contrarian indicators. The more pessimistic investors are at that moment, the greater chance that the stock market is likely to rally.
Below is yet another graphic from Charlie Bilello. (He is awesome!)
This shows the levels of “bullish” or “bearish” sentiment in the survey of thousands of investors who are part of the American Association of Independent Investors (AAII).
These are active investors, and the survey has been around for many decades. Here is the data, along with his commentary.
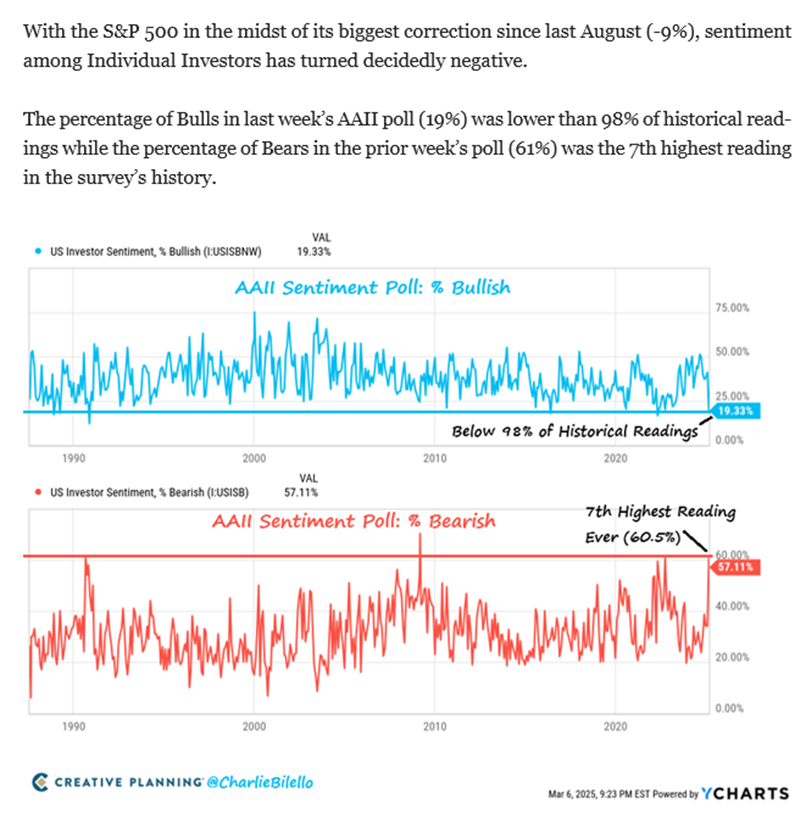
Source: @charliebilello
As Charlie notes, we are at historic levels in terms of the least number of “bullish” investors and the most amount of “bearish” investors.
Historically when we have hit these levels, the stock market has ALWAYS rallied — at least in the short term.
Here is another chart, showing the levels of the CNN Fear & Greed Index along with the S&P 500 price chart.
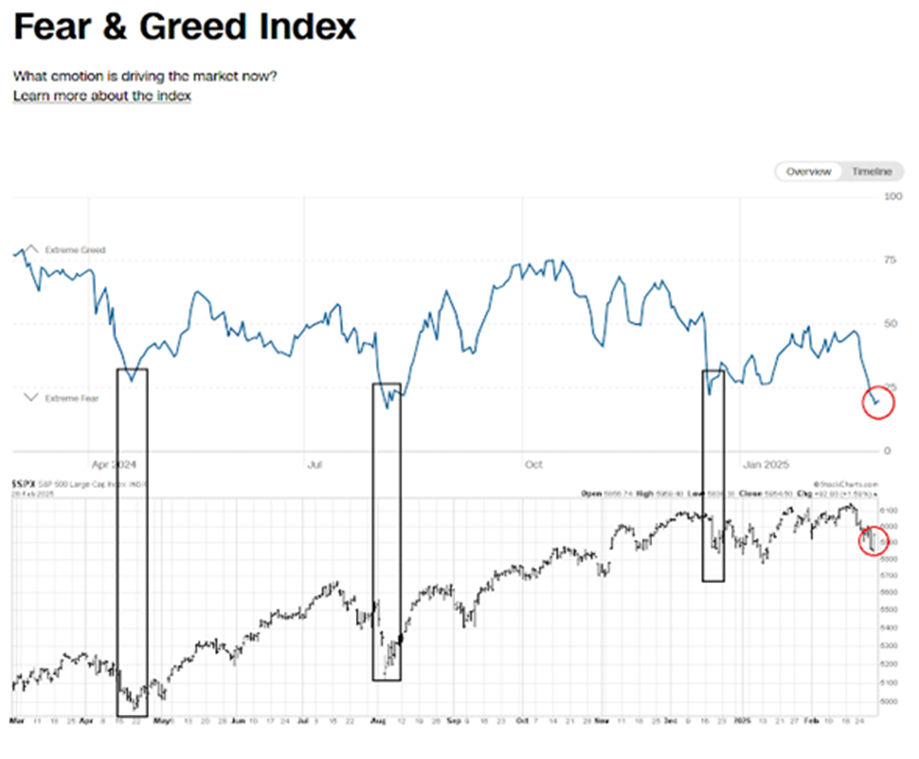
Once again, you can see that the stock market has rallied strongly (at least in the short term) from these levels.
Sentiment being bad — especially historically bad — is very good for the stock market.
4. Proximity to All-Time High Highs
Our final data point is that we are just coming off all-time highs in the stock market. When we see a steep selloff quickly after recent highs, the stock market rallies every time.
Here is a table from Bespoke Investment Research showing what happens in the S&P 500 when it declines 7.5% within three weeks of an all-time high.
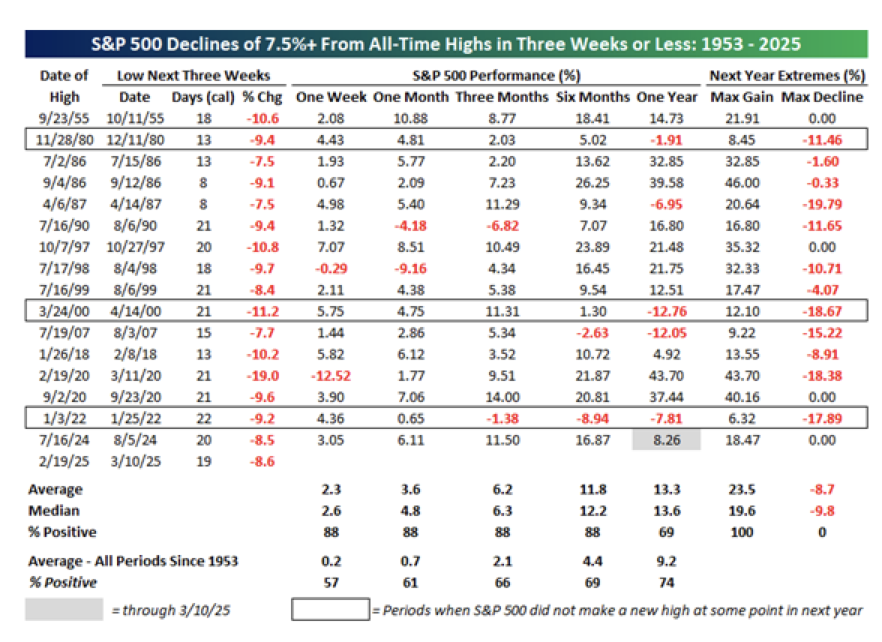
Source: Bespoke Investment Research
Looking at the chart, you can see that the stock market was higher one week to six months later 88% of the time. Even when it went down, it was never down double digits.
Even more impressively, every single time the stock market was higher (for at least a period) at some point afterward.
This is 70 years of data.
There are few guarantees in investing. But I think buying the stock market RIGHT NOW is one of them!
Sign Up Today for Free!
Truth & Trends brings you market insights and trading tips you won't find anywhere else — unless you have your own personal hedge fund manager on speed dial...
Meet Enrique Abeyta, one of Wall Street’s most successful hedge fund managers. With years of experience managing billions of dollars and navigating the highs and lows of the financial markets, Enrique delivers unparalleled market insights straight to your inbox.
In Truth & Trends, Enrique shares his personal take on what’s moving the markets, revealing strategies that made him a star in the world of high finance. Whether it’s uncovering the next big trend or breaking down the hottest stocks and sectors, Enrique’s insights are sharp, actionable, and proven to work in any market condition.
Inside these daily updates, you’ll gain:
- 50 years of combined trading wisdom distilled into actionable insights.
- A behind-the-scenes look at how Wall Street pros spot opportunities and avoid pitfalls.
- Exclusive strategies that Enrique personally uses to deliver exceptional returns — no fluff, just results.
To have Truth & Trends sent directly to your inbox every weekday, just enter your email address below to join this exclusive community of informed traders.
Don’t miss your chance to learn from one of the best in the business.
Sign up now and take your trading game to the next level.
Six Months In: My 2026 Report Card
Posted July 06, 2026
By Enrique Abeyta

The S-E-T System for Finding Breakout Stocks
Posted July 03, 2026
By Greg Guenthner

6,019 Reasons to Be a Proud American
Posted July 02, 2026
By Enrique Abeyta

The Kid Who Worked the Drive-Thru Last Year Is Building Gigasats Today
Posted July 01, 2026
By Ray Blanco

The AI Arms Race Just Got Literal
Posted June 29, 2026
By Enrique Abeyta
