
Posted April 03, 2025

By Enrique Abeyta
Exactly When Panic Turns Into Profits
The market’s unraveling — and you can feel it in your chest.
The S&P is down 4% and the Dow and tech-heavy Nasdaq aren’t far behind.
Your screen is a sea of red. Maybe your palms are sweating. Maybe you’re frozen, just staring at the numbers, thinking about your portfolio and 401k.
You’re not alone. Right now, everyone’s trying to figure out what just happened.
President Trump announced sweeping new tariffs last night. Trade war, global slowdown, political chaos — take your pick.
The reason doesn’t matter. What matters is what happens next.
Because in moments like this, your brain doesn’t process numbers. It processes threats. You don’t feel like a rational investor; you feel like prey. That’s biology.
And that’s why people make the worst decisions in the middle of a selloff.
But here’s what three decades in the markets has taught me: Every panic feels different, but they all act the same.
Whether it was COVID, the financial crisis, or the dot-com crash, we’ve seen this movie before. And we know exactly what to watch for.
Every major BEAR market of the last 30 years — the 2022 post-COVID hangover, the 2020 COVID period, the Global Financial Crisis of 2008/9, and the Internet Bubble of 2000/01 — saw major snapback rallies happen.
So strap on your gloves and tighten those laces.
It’s time to counter-punch your way through this selloff because the next snapback rally is setting up right now.
Here are four key signals you should be watching for.
1. 90% Downside Volume
We want to see real PANIC selling in the stock market.
We know this happens when 90% of the shares traded on the New York Stock Exchange are trading lower versus higher.
This is a powerful indicator that panic is set here and investors are selling irrationally.
Here is a chart showing the percentage of up versus down traded volume on the NYSE.
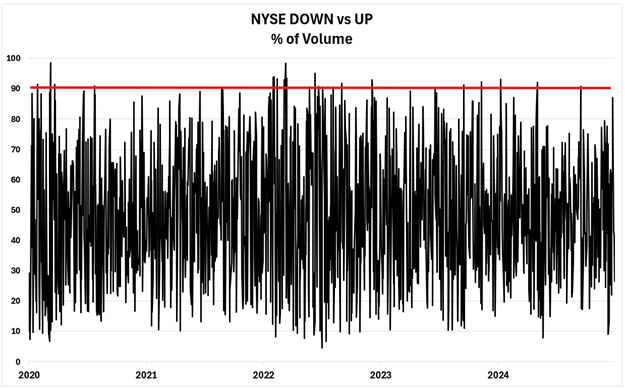
We have drawn a red line at this level.
This is one of the key signs that we will be looking for in a short-term tradeable bottom in the stock market.
Now, this doesn’t mean THE bottom. Rather we are looking for an opportunity where the market will trade higher between 5% to 10%.
This can be seen as an opportunity to exit losing positions. It also can be seen as an opportunity to take profits on anything you buy once you see the bottom.
2. VIX Over 30
The CBOE Volatility Index (or VIX) is a financial benchmark designed to capture the expected volatility in the S&P 500.
Think of it as a measure of how crazy people think the moves are going to be in the stock market.
It is also another good contrarian indicator of panic.
Here is a table showing the VIX over the last few years.
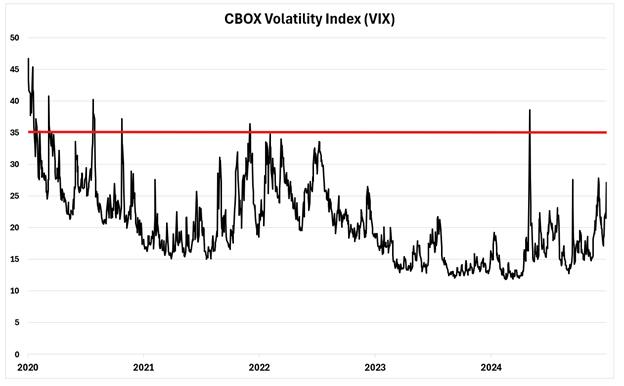
We have drawn a red line at this level on the chart.
On the chart, you will see that the last time we breached this level was back in August of last year. This set up both a tradeable bottom and a sustainable recovery to new highs.
The previous time we hit this level was back in early 2022. This did NOT set the bottom for a recovery to new highs, but it did set the bottom for a great tradable opportunity.
It does not have to be EXACTLY at the 35 level. Back in 2022, it got close several times and those created tradeable (and profitable) opportunities.
3. Put/Call Ratio
Like the VIX, the Put/Call Ratio is another calculation put together by the CBOE. It looks at the ratio of call options being bought versus put options.
Call option buying shows investor optimism. The vast majority of the time, there are more calls being bought than put options and this number is below 1.
Very occasionally, though, investor pessimism is so high that there are more puts being bought than call options.
When this happens, it’s another contra-indicator and strong sign of a tradeable bottom.
Here is the chart showing this calculation.
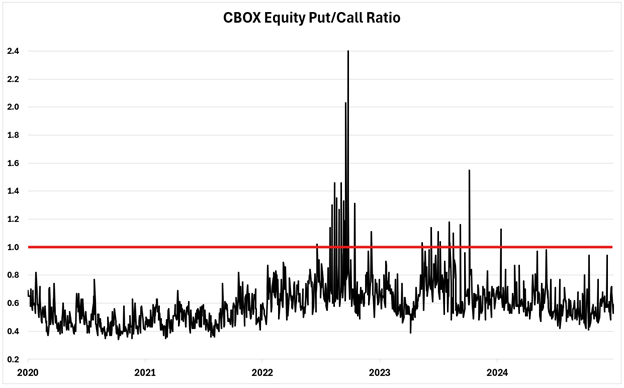
Again, we have used a redline, and you can see that this did not happen last January. That set a good tradeable bottom.
On the chart, you can see that it can happen a lot in a difficult stock market. We can see this during the correction in the second half of 2023 and the market bottom in late 2022.
This is why we really look at this one in conjunction with the other indicators.
Either way, we have not seen it yet. But if we do, it will be a good sign of an opportunity.
4. NASDAQ New Highs Vs New Lows
The previous three indicators are contrarian signals. They show extreme panic, and we want to buy that emotional reaction.
The final indicator we are looking for is a “positive divergence.” This indicates to us that underneath the surface, we are seeing improvement.
In this case, it is the number of stocks on the NASDAQ that are setting new 52-week highs versus new 52-week lows.
In a steep market selloff, we are not going to see more highs by definition.
What we are interested in seeing is whether we are setting FEWER new lows as the market moves lower.
Here is a chart showing this ratio.
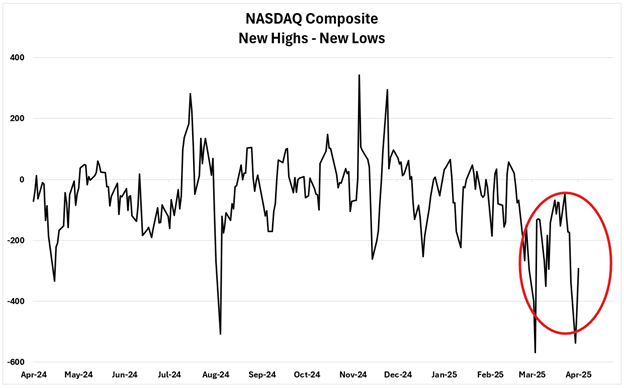
We need to see the data develop. But if we see the other three indicators reach our desired levels AND this number moves higher, we have a perfect setup.
The reality of trading is that you almost never see that perfect setup. More often, you get close and have to decide whether to trade it.
The way we can adjust is through our position sizing and total exposure.
The key here is that we can make money in even the most volatile of stock markets. All you need is a great plan.
As I often say: plan the trade, trade the plan.
Sign Up Today for Free!
Truth & Trends brings you market insights and trading tips you won't find anywhere else — unless you have your own personal hedge fund manager on speed dial...
Meet Enrique Abeyta, one of Wall Street’s most successful hedge fund managers. With years of experience managing billions of dollars and navigating the highs and lows of the financial markets, Enrique delivers unparalleled market insights straight to your inbox.
In Truth & Trends, Enrique shares his personal take on what’s moving the markets, revealing strategies that made him a star in the world of high finance. Whether it’s uncovering the next big trend or breaking down the hottest stocks and sectors, Enrique’s insights are sharp, actionable, and proven to work in any market condition.
Inside these daily updates, you’ll gain:
- 50 years of combined trading wisdom distilled into actionable insights.
- A behind-the-scenes look at how Wall Street pros spot opportunities and avoid pitfalls.
- Exclusive strategies that Enrique personally uses to deliver exceptional returns — no fluff, just results.
To have Truth & Trends sent directly to your inbox every weekday, just enter your email address below to join this exclusive community of informed traders.
Don’t miss your chance to learn from one of the best in the business.
Sign up now and take your trading game to the next level.

The Biggest IPO You Never Heard About
Posted July 13, 2026
By Enrique Abeyta
My Tesla Calls Went to Zero... Just as I Planned
Posted July 10, 2026
By Greg Guenthner

Mark Twain Was Right About Your Newsfeed
Posted July 09, 2026
By Enrique Abeyta
Six Months In: My 2026 Report Card
Posted July 06, 2026
By Enrique Abeyta
The S-E-T System for Finding Breakout Stocks
Posted July 03, 2026
By Greg Guenthner
