
Posted February 24, 2025

By Enrique Abeyta
Before You Buy: Your Checklist for a Perfect Trade
The smart money will tell you that you can’t beat the market.
They’ll say the only way for you to succeed is to simply give them your money and let them run it for you.
They are WRONG. With a great system and a great process, you can generate strong returns.
That is why I’ve developed a proprietary system to identify trade setups with the highest probability of success.
I previously walked through the 15-point scoring system I use to identify trades, using a real example from our trading service The Maverick.
It’s simple: The more points a stock scores, the higher the probability that it will be a profitable trade.
Over the years, the system has done very well, with hit rates exceeding 70% across the board.
In fact, the most recent iteration of our software has produced an 80% success rate for stocks scoring a rare “15/15.”
Last week, we dove into our analysis's technical or price-driven side. I shared the 6 points we look at from a technical perspective.
Stocks that only hit these 6 points are usually great bets. But what makes this system even more powerful is that we don’t stop there.
Here is the rest of my checklist for a perfect “15/15” trade.
The Fundamentals, Starting With EPS Growth
In addition to the technicals that I outlined last time, our system also looks at a company’s fundamentals.
This means the operating performance of the company —how they are performing in terms of revenue, cash flow, and earnings.
This analysis is key because investors buy stocks with the belief that they are buying the business.
Businesses that are growing and performing well are more attractive to investors.
In my analysis, I look at how the company has done recently to figure out which stocks are the most attractive.
First, I look at growth.
You will hear a lot of “rules” of what makes stocks go up, but I will tell you there is one that ALWAYS works — growth.
Find a company that is growing earnings from $1 per share to $10 per share, and you will find a stock that is going UP.
It might go up a little or a lot. It might go up now, or it might go up later. In all scenarios, though, it is going up.
In our system, we go back and look at the previous three years of results for revenue, cash flow, and earnings.
We are looking for 75% of those 12 (three years of quarters) data points to be higher year-over-year. If this is true, we assign one point for each of these three financial metrics.
Going back to our “perfect stock” from last week, Brown & Brown Inc. (BRO), here is a table showing the quarterly EPS results over the last three years.
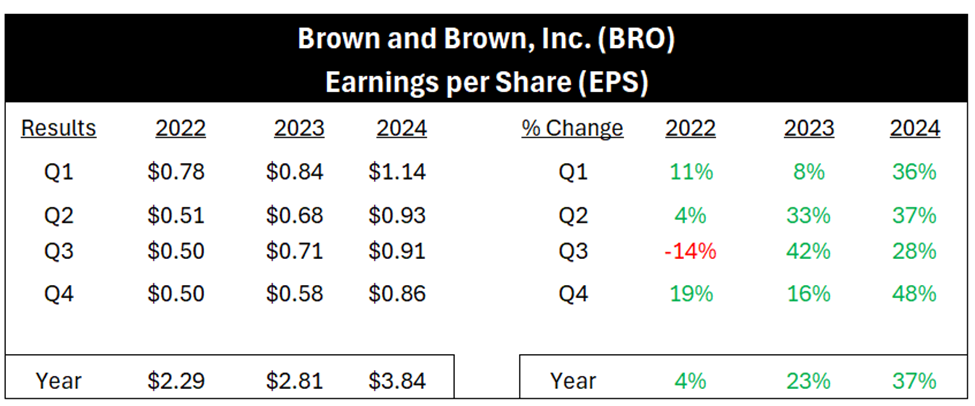
BRO has grown every quarter except one.
These are the results for EPS, but the results for revenue and cash flow (as measured by EBITDA) are the same. This is how BRO scored three points on this measure.
Earnings Beats
Next, we are looking at how a company performs versus expectations.
Companies that do better than expectations will usually have strong stocks.
This is driven by human psychology. Would you rather own a company that is consistently doing BETTER than you expected or one that is doing WORSE?
Without trying to be intellectual about the answer, the fact is people want to own companies that are doing better.
Like growth, we look back at the previous 12 quarters and look for a company that has beat analysts’ expectations for at least 75% of those quarters.
Here is a table showing the data on EPS for BRO.
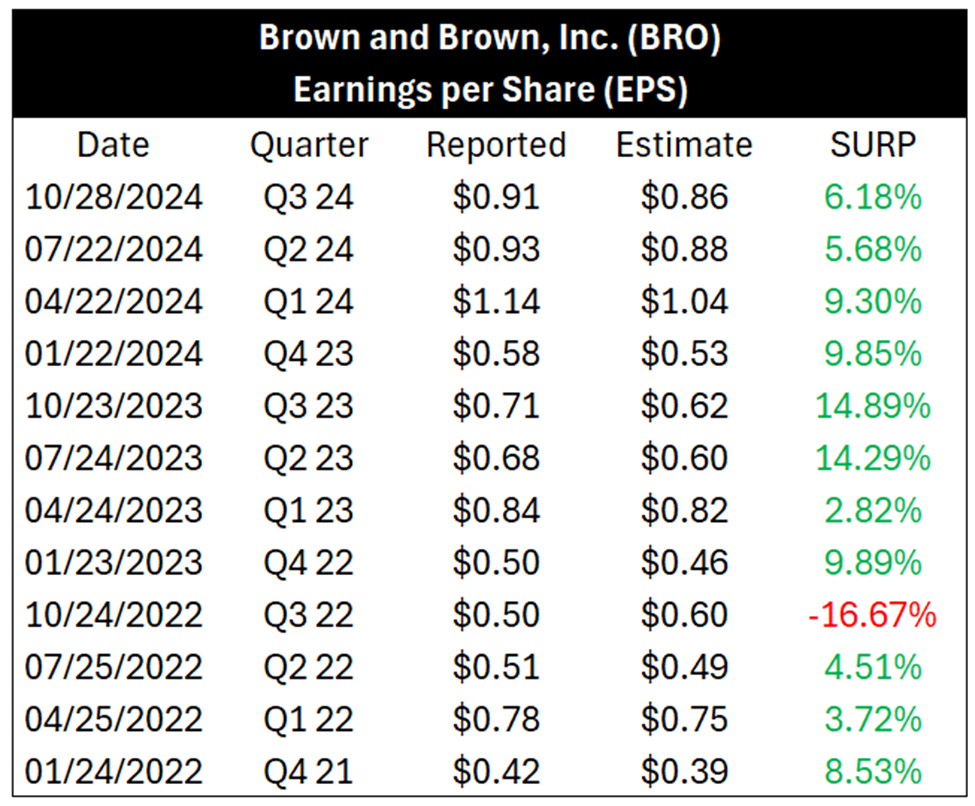
The results are identical to the growth results. The company has beat expectations every quarter except one over the last three years.
The same is true for their revenue and cash flow. This is how it earned another three points on its way to a “15/15” perfect score.
Upward Revisions
Finally, I look at what are called earnings revisions.
All the large companies in the stock market have many Wall Street analysts who cover the stock. Part of their research is building financial models where they attempt to predict future results.
These predictions (called estimates) are what many investors use to value a stock. In theory, the value of a stock is the value of its future cash flows, so this makes sense.
When a company is beating numbers, the analysts will then move their future estimates higher. This should mean that the stock is more valuable.
In practice, this is one of the most powerful driving forces in the stock market.
In particular, we are looking for companies that show at least three consecutive positive earnings revisions. Stocks that exhibit that pattern often will see explosive future returns.
Here is a chart showing the stock price of BRO along with the revisions for 2025 EPS.
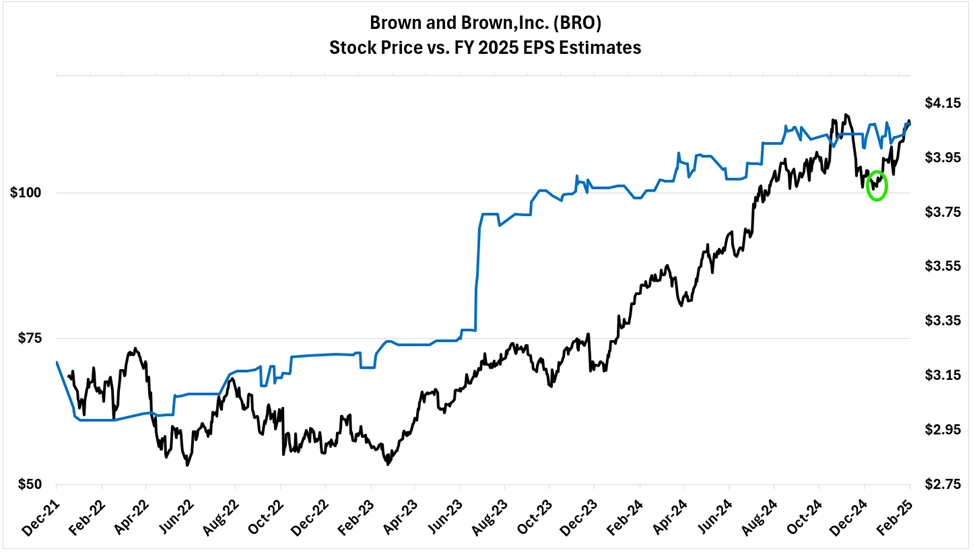
On the chart, you can see that these estimates have moved up consistently over the last few years. You can also see that the stock has moved up with them.
I also noted on the chart when we made our “buy” recommendation to our readers.
Like the growth metrics and performance versus expectations, the estimates have moved higher for BRO, not just on EPS but also on revenue and cash flow.
This is how it scored another three points and completed the “15/15” perfect score.
Sign Up Today for Free!
Truth & Trends brings you market insights and trading tips you won't find anywhere else — unless you have your own personal hedge fund manager on speed dial...
Meet Enrique Abeyta, one of Wall Street’s most successful hedge fund managers. With years of experience managing billions of dollars and navigating the highs and lows of the financial markets, Enrique delivers unparalleled market insights straight to your inbox.
In Truth & Trends, Enrique shares his personal take on what’s moving the markets, revealing strategies that made him a star in the world of high finance. Whether it’s uncovering the next big trend or breaking down the hottest stocks and sectors, Enrique’s insights are sharp, actionable, and proven to work in any market condition.
Inside these daily updates, you’ll gain:
- 50 years of combined trading wisdom distilled into actionable insights.
- A behind-the-scenes look at how Wall Street pros spot opportunities and avoid pitfalls.
- Exclusive strategies that Enrique personally uses to deliver exceptional returns — no fluff, just results.
To have Truth & Trends sent directly to your inbox every weekday, just enter your email address below to join this exclusive community of informed traders.
Don’t miss your chance to learn from one of the best in the business.
Sign up now and take your trading game to the next level.

Quick 5-Minute Masterclass on Finding Breakout Stocks
Posted April 10, 2026
By Greg Guenthner

3 Must-Own Stocks as the War Rages on
Posted April 06, 2026
By Enrique Abeyta

Embrace the Divine to Improve Your Trading
Posted April 02, 2026
By Enrique Abeyta

Iran: Fast Checkmate, But Maybe No Winner
Posted March 30, 2026
By Enrique Abeyta

Welcome to the Worst Possible Market
Posted March 27, 2026
By Greg Guenthner
![[48 Hours] One Step Closer to the Iran Endgame](http://images.ctfassets.net/vha3zb1lo47k/7o9bZ7e2QPeTe7qntxzXPc/71c43dd00c51b9ab72e63f054396cac7/ttr-issue-03-26-26-img-1.jpg)