
Posted March 09, 2026

By Enrique Abeyta
A Crude Awakening: History Says Buy Stocks
Oil futures just saw their largest spike in history.
Crude shot up above $100 a barrel over the weekend, 50% higher than two weeks ago and almost double the December low.
As you can see on the chart below, this was a massive jump after years of relative calm.
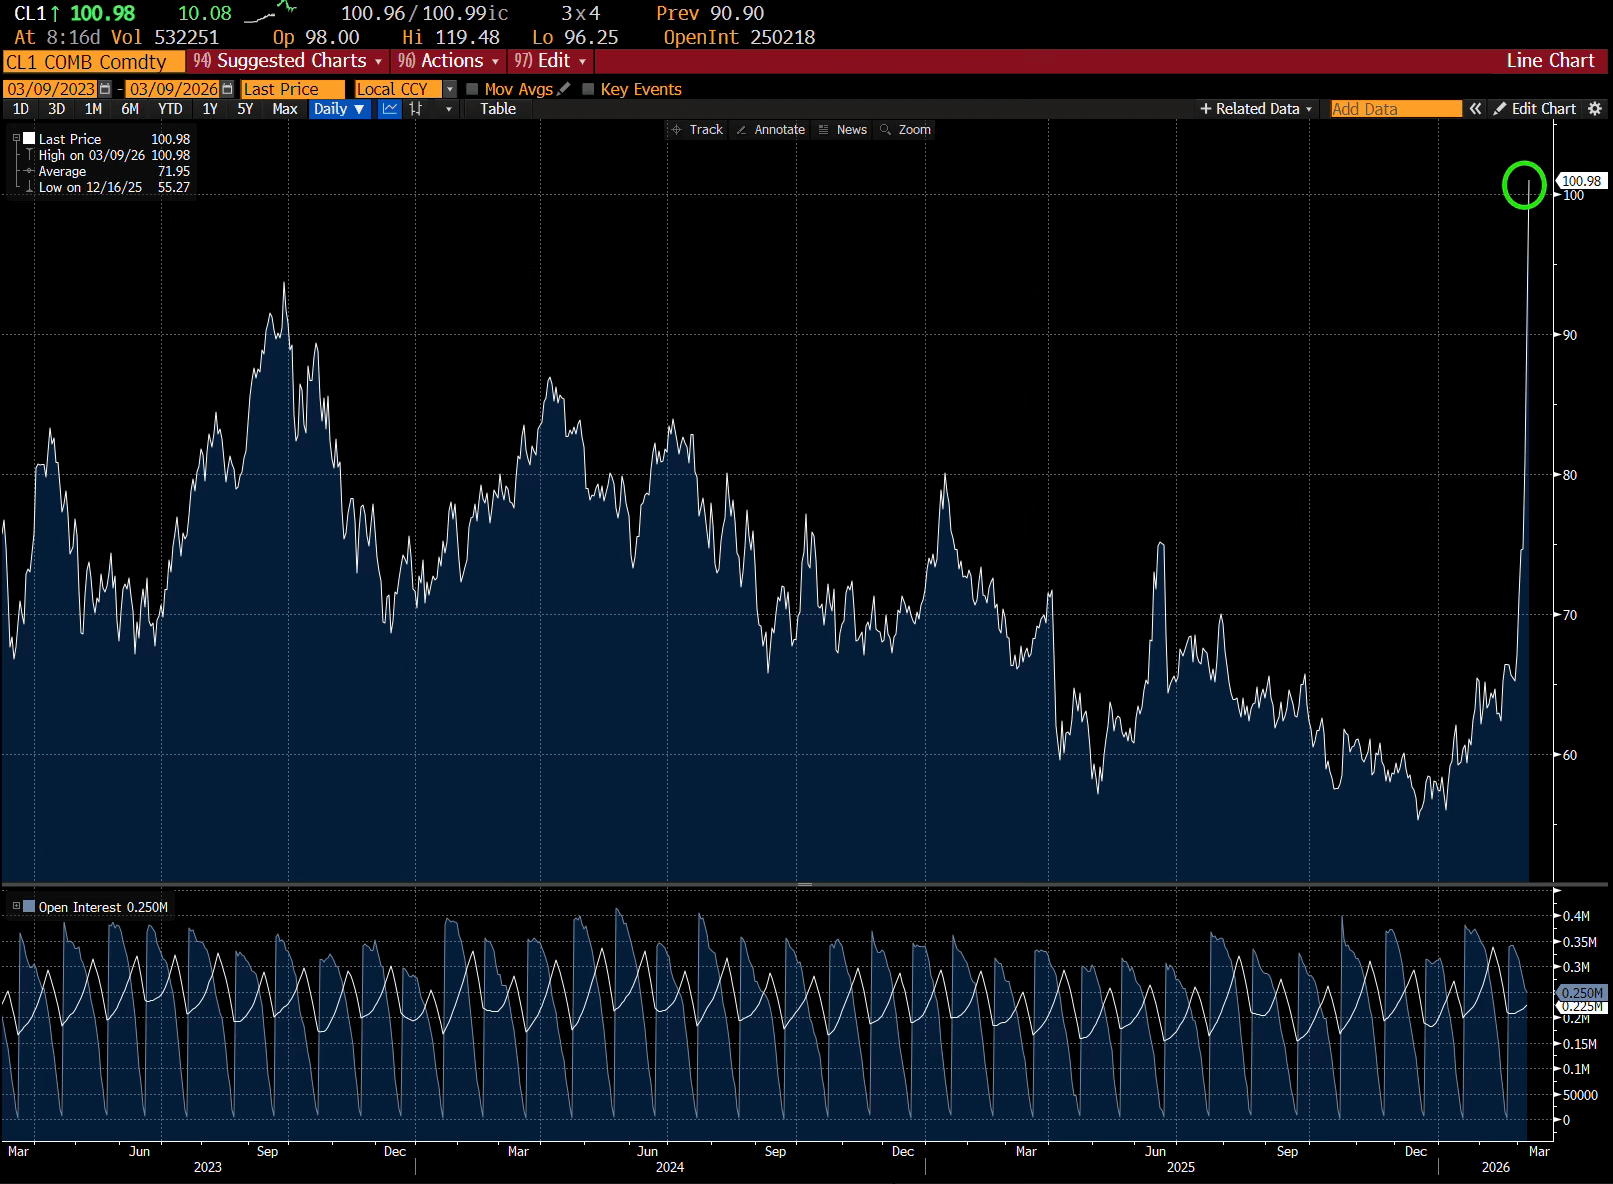
Oil prices retreated back below $90 today, but the situation in Iran is constantly developing.
So everyone wants to know where oil prices go next and what it means for stocks.
Nobody can say for sure, but we do have history as a guide.
What Happens to Stocks After an Oil Spike
Here’s a table from Bespoke Investment Group showing every time that oil prices have gone up at least 20% in one week since 1985.
It also shows how the S&P 500 performed after each one of these price spikes.
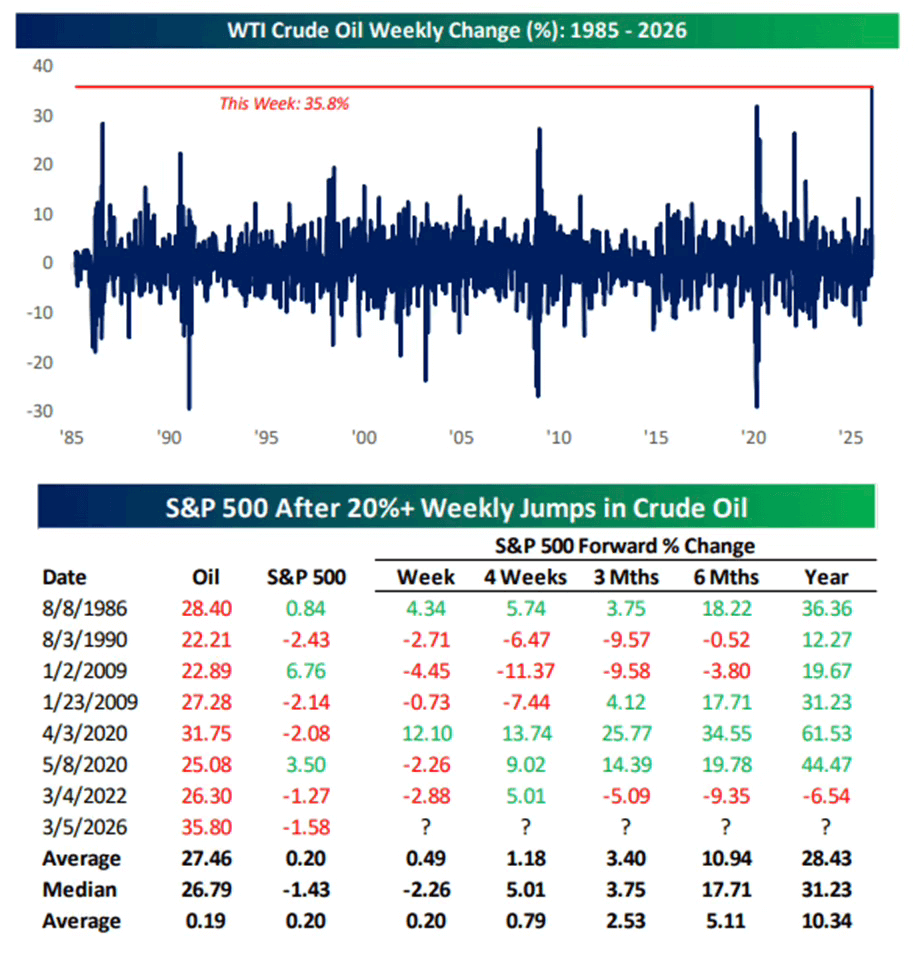
Source: Bespoke Investment Group
Why only go back to 1985 and leave out the oil price shocks of the 1970s?
The quick answer is that the oil market and global economy look a lot different today than they did in the 1970s.
Back then, oil coming from the Persian Gulf was upwards of 40% of the world’s total oil production. Oil also had a much greater impact on the global economy.
Roughly 20% of oil comes from the region today, and half of that can be diverted through the Red Sea. So we are really looking at 10% of the global supply impacted.
Now go back to the table, and you can see the performance of the S&P 500 weeks, months, and one year after these price spikes.
The first takeaway is that in the following few weeks and months, the performance of the stock market was choppy.
One week later, it was down two-thirds of the time. Three months later, it was down 60% of the time.
The downward moves may not be big, but the market clearly struggles to digest oil spikes at first.
Looking out one year, however, the stock market was higher 86% of the time with an almost 30% return — more than double the stock market’s average.
The only time the market wasn’t up one year out was in 2022. Even then, it was only down 6.5%, which isn’t very much.
This relationship is clear from the overall data: higher oil prices correlate with higher stock prices over time.
Now that we’ve looked at the broader trend, let’s take a look at each of these periods in some detail for more insight.
A Brief History of Oil Spikes
The first oil spike in this data set was in August 1986. Here is the chart of the price of crude oil (white) and the S&P 500 (blue).
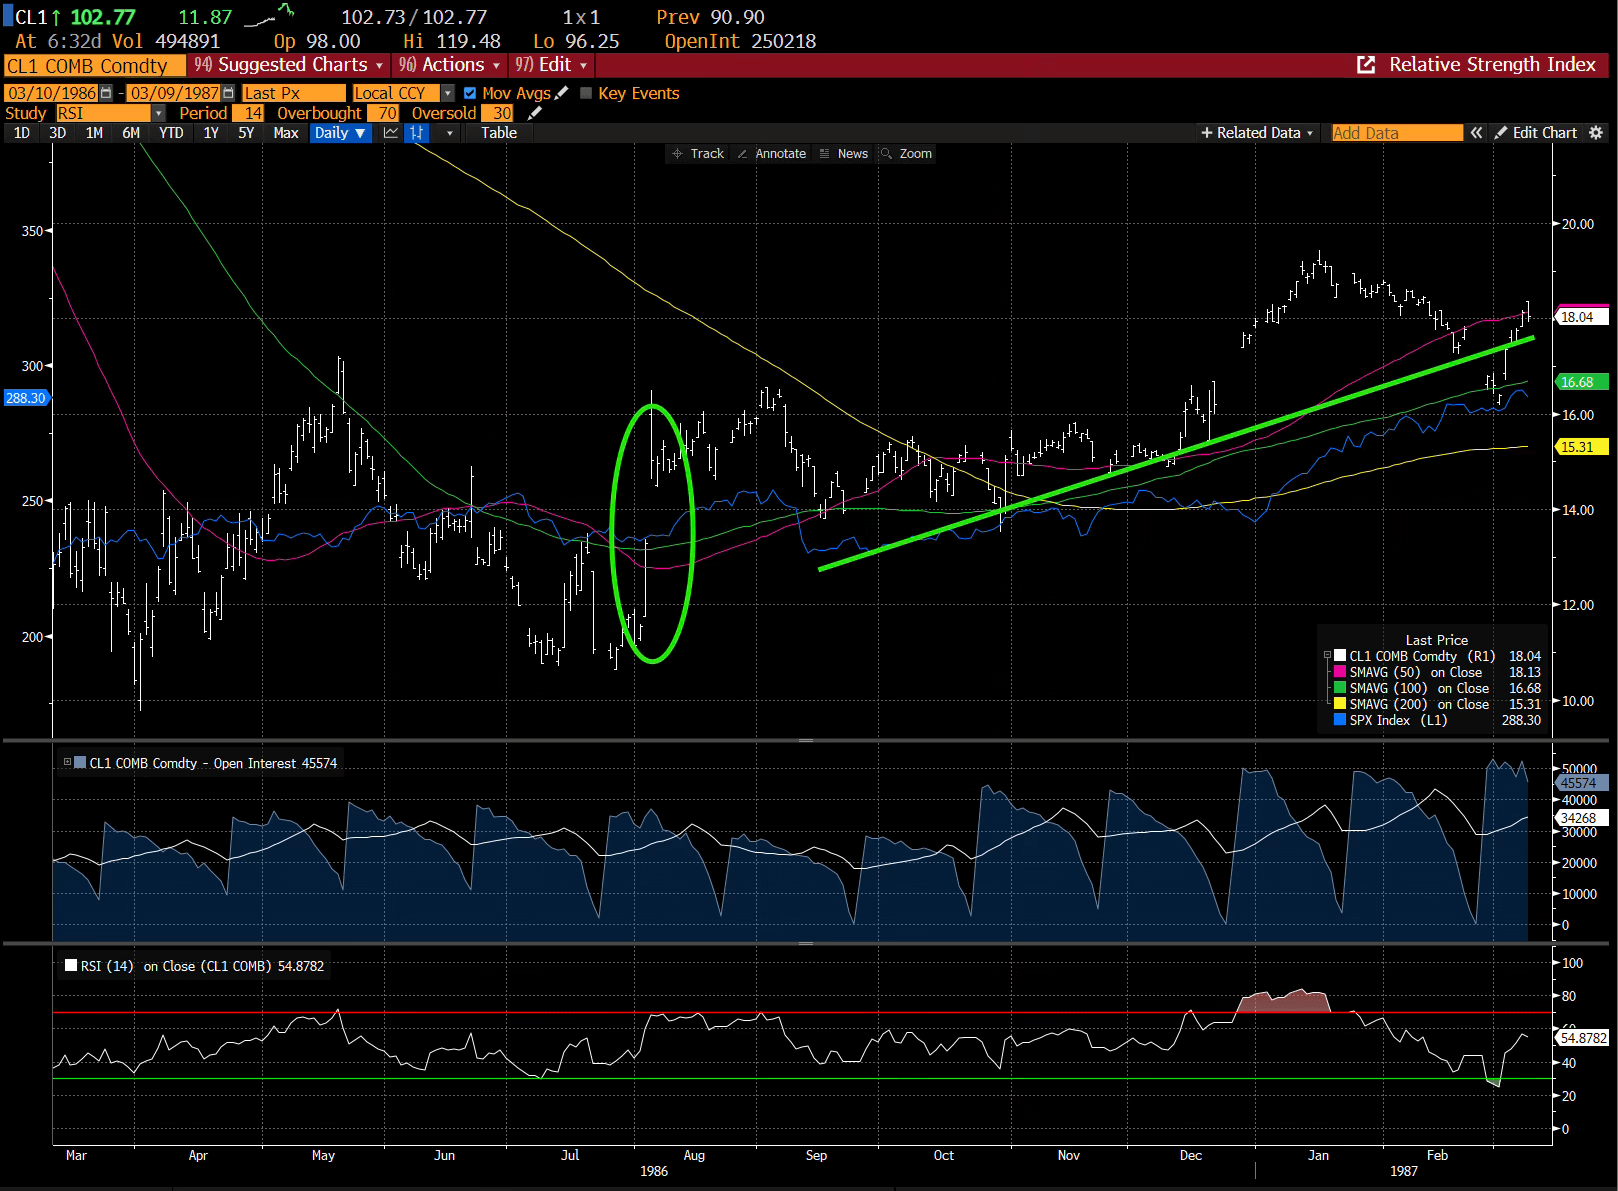
In this instance, oil prices had been trending down for many months and then spiked from a low after OPEC announced supply cuts.
The impact on the stock market was negligible. Both oil prices and the stock market moved higher in the following year.
The next instance is much more similar to today. It was in August 1990 when Saddam Hussein and Iraq surprisingly invaded Kuwait.
Here is the same chart.
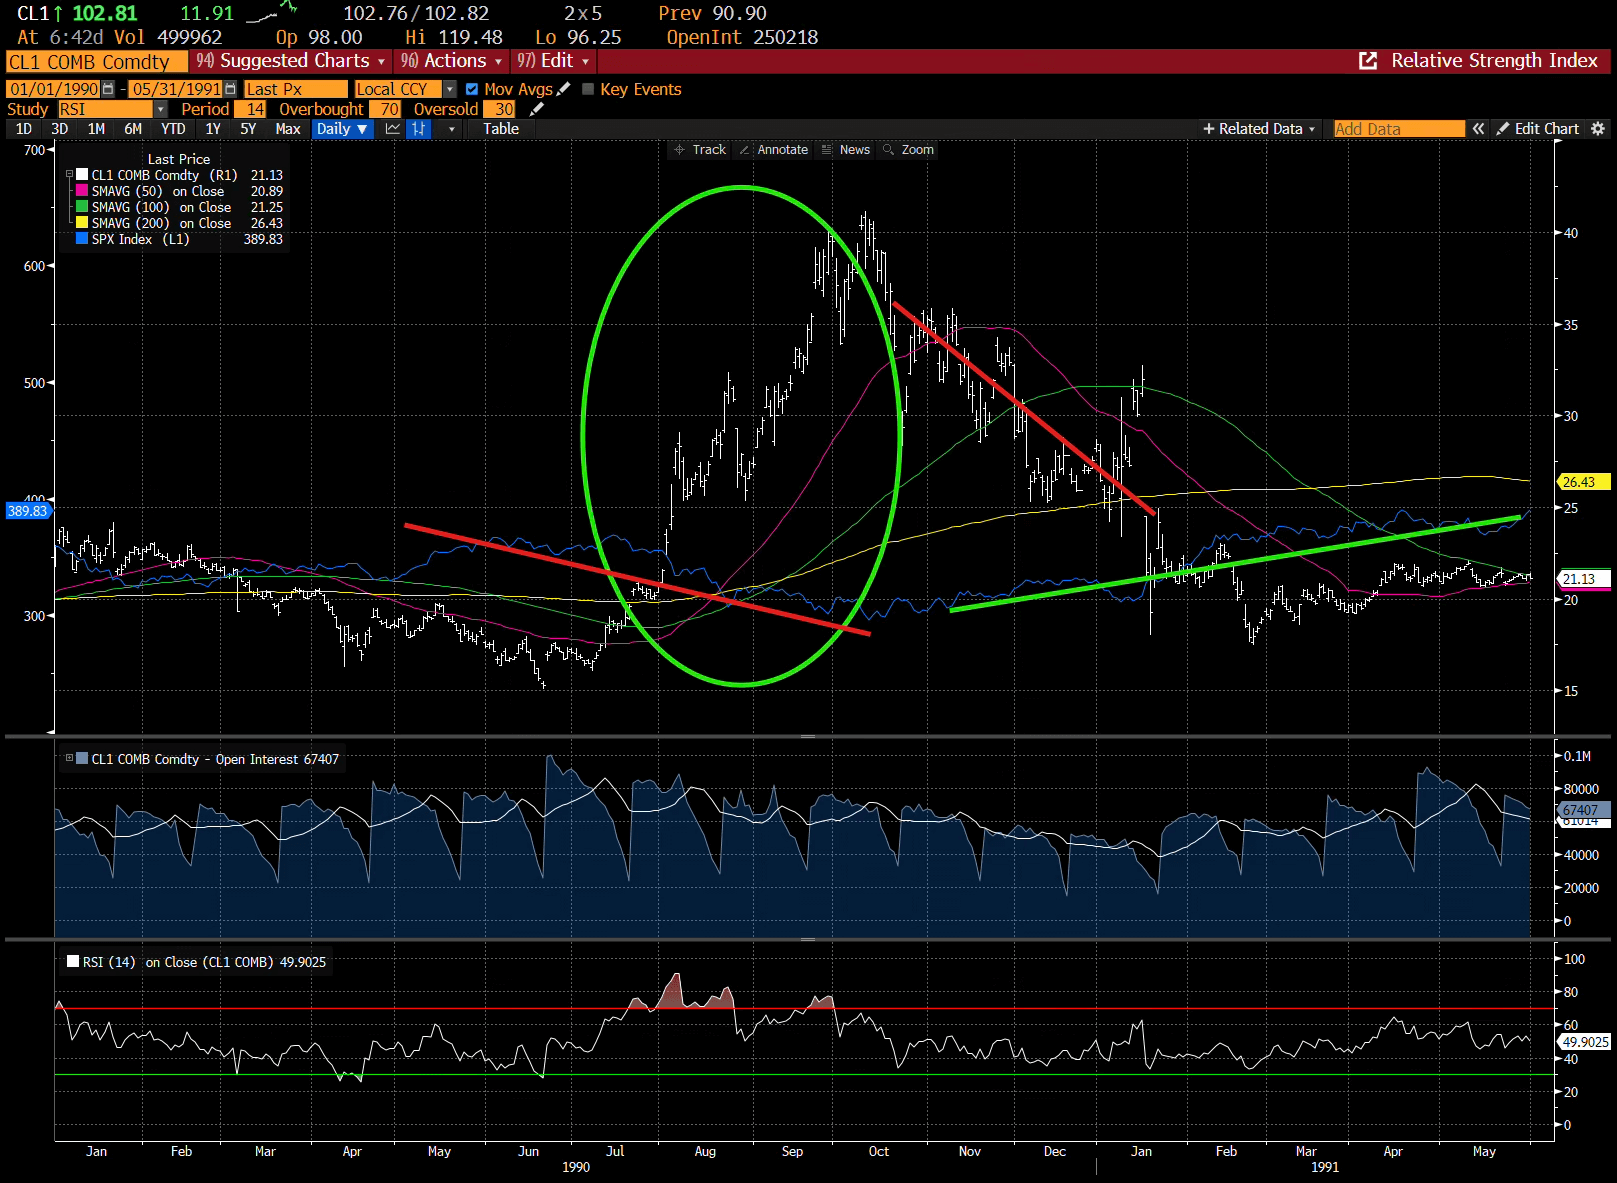
There are a couple of important differences in this chart.
First, oil moved higher for much longer, roughly three months. And second, the stock market had been trending lower before the oil spike.
This combination is important.
Stocks responded more negatively because they were already under pressure leading into the catalyst that caused oil to climb.
The next instance happened in early 2009. Here is that chart.
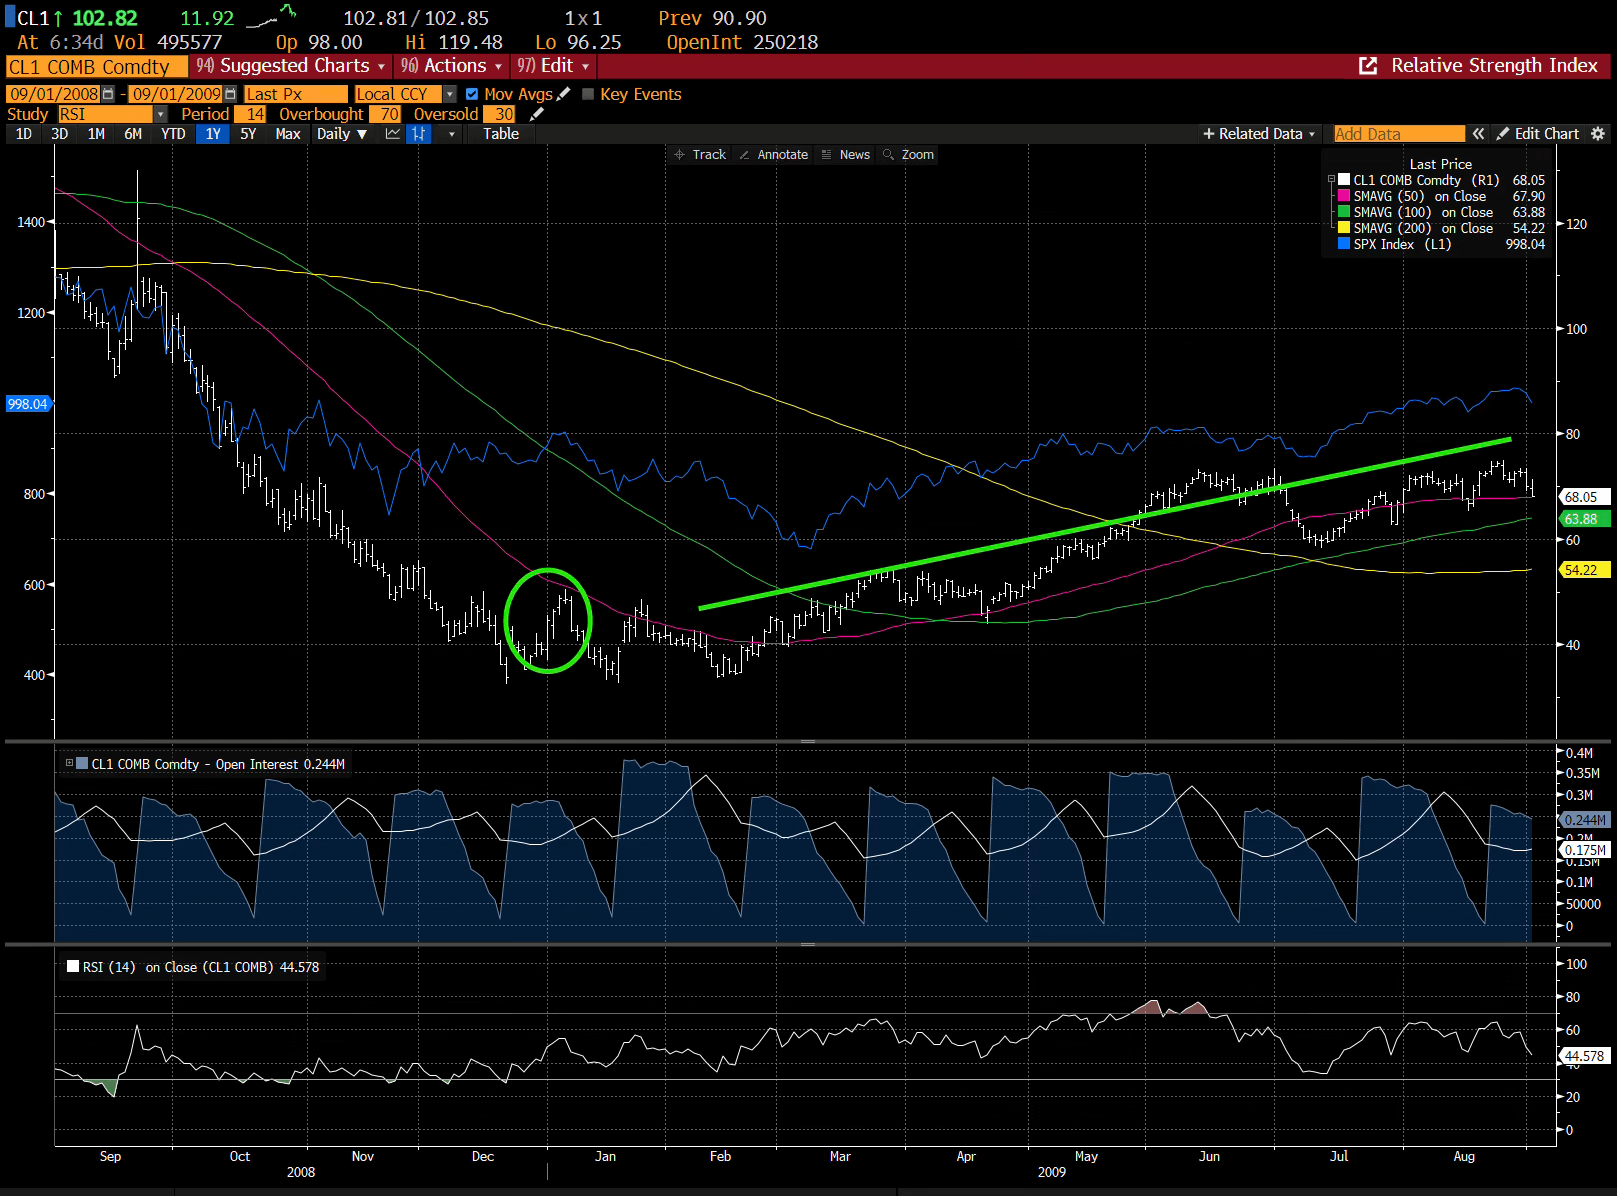
Oil briefly surged above $50 per barrel, driven by violence in Gaza and a dispute between Russia and Ukraine over gas supply.
It also coincided with a period of cold weather and oil prices reaching oversold levels, which led to a spike.
This instance is similar to the move in 1986, since oil prices spiked after declining dramatically for the previous six months.
The outcome was also similar. Oil prices proceeded to grind higher along with the stock market.
The next episode happened in 2020 during the early stages of COVID. Here is that chart.
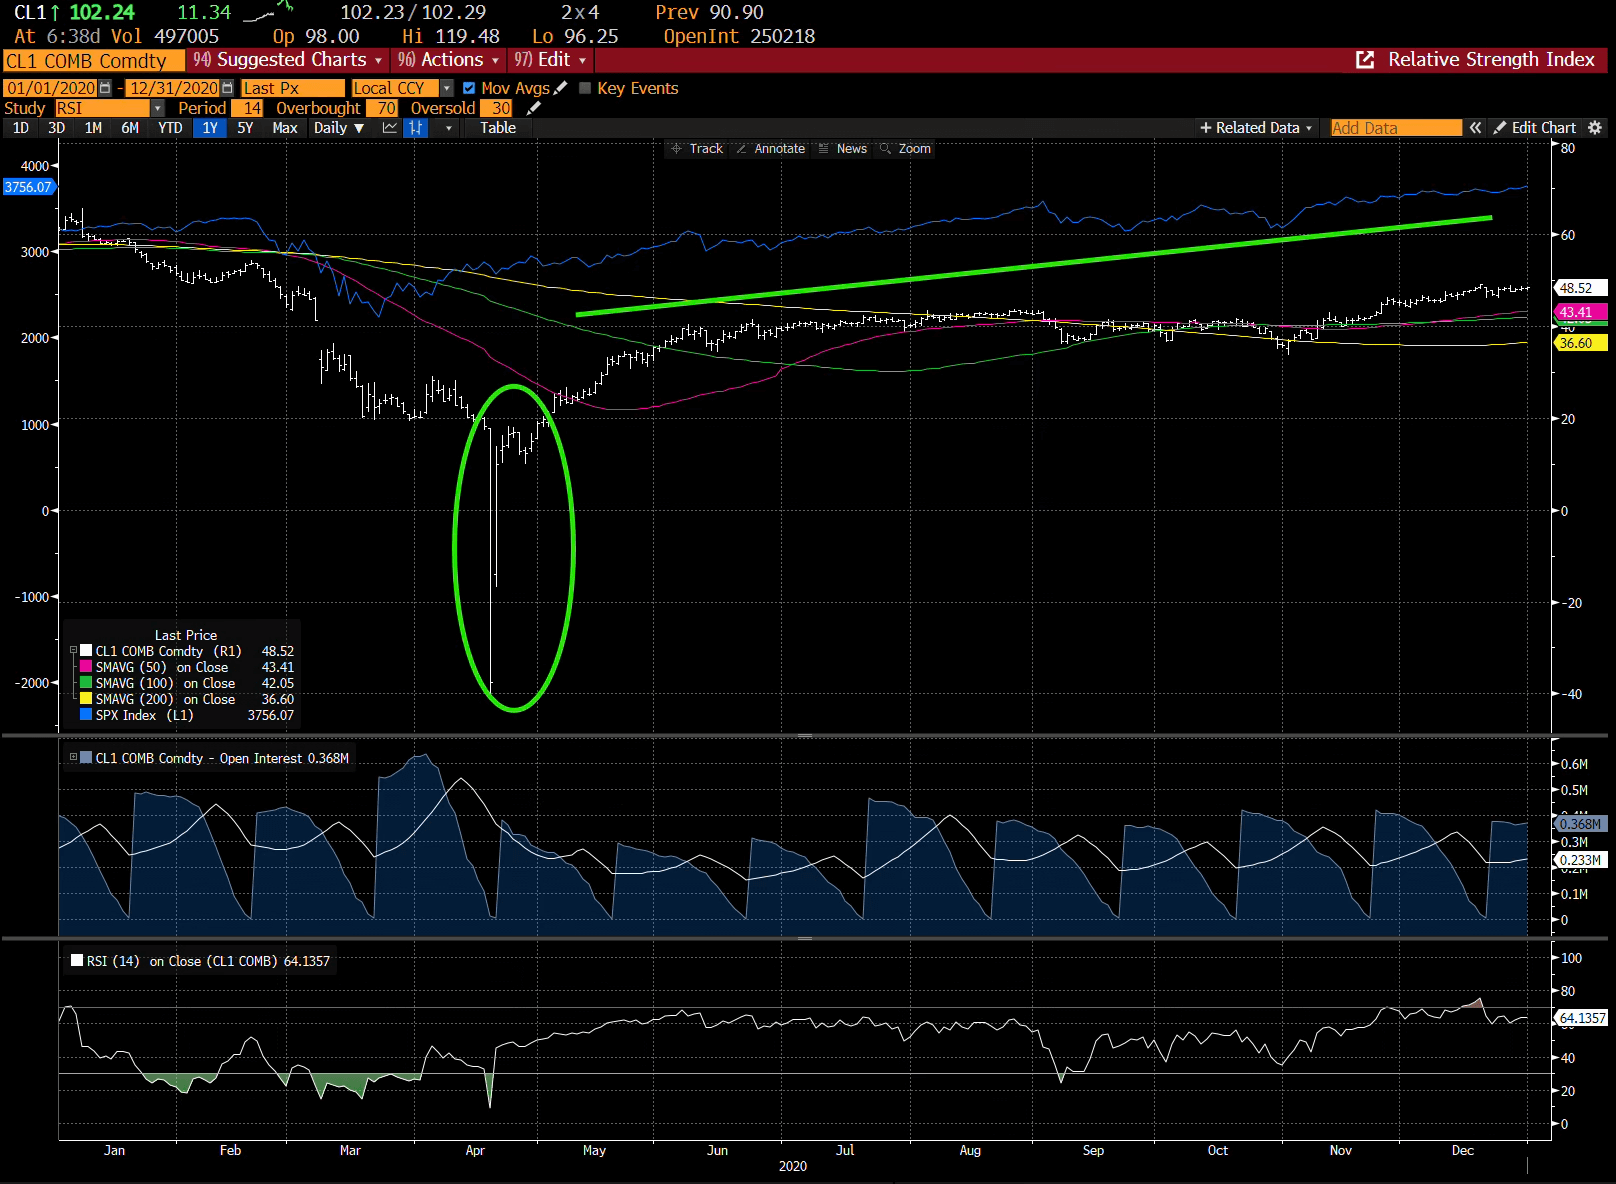
This one is a bit of an outlier. But I still wanted to include it, even if there’s not much to take away.
Oil had been going down with risk assets heading into the COVID collapse. Crude oil futures were then hit with some technical factors that drove the price below $0.
Oil prices recovered along with the stock market after that, similar to both 1986 and 2009.
Here is the final and most recent episode. This was in 2022 when Russia invaded Ukraine.
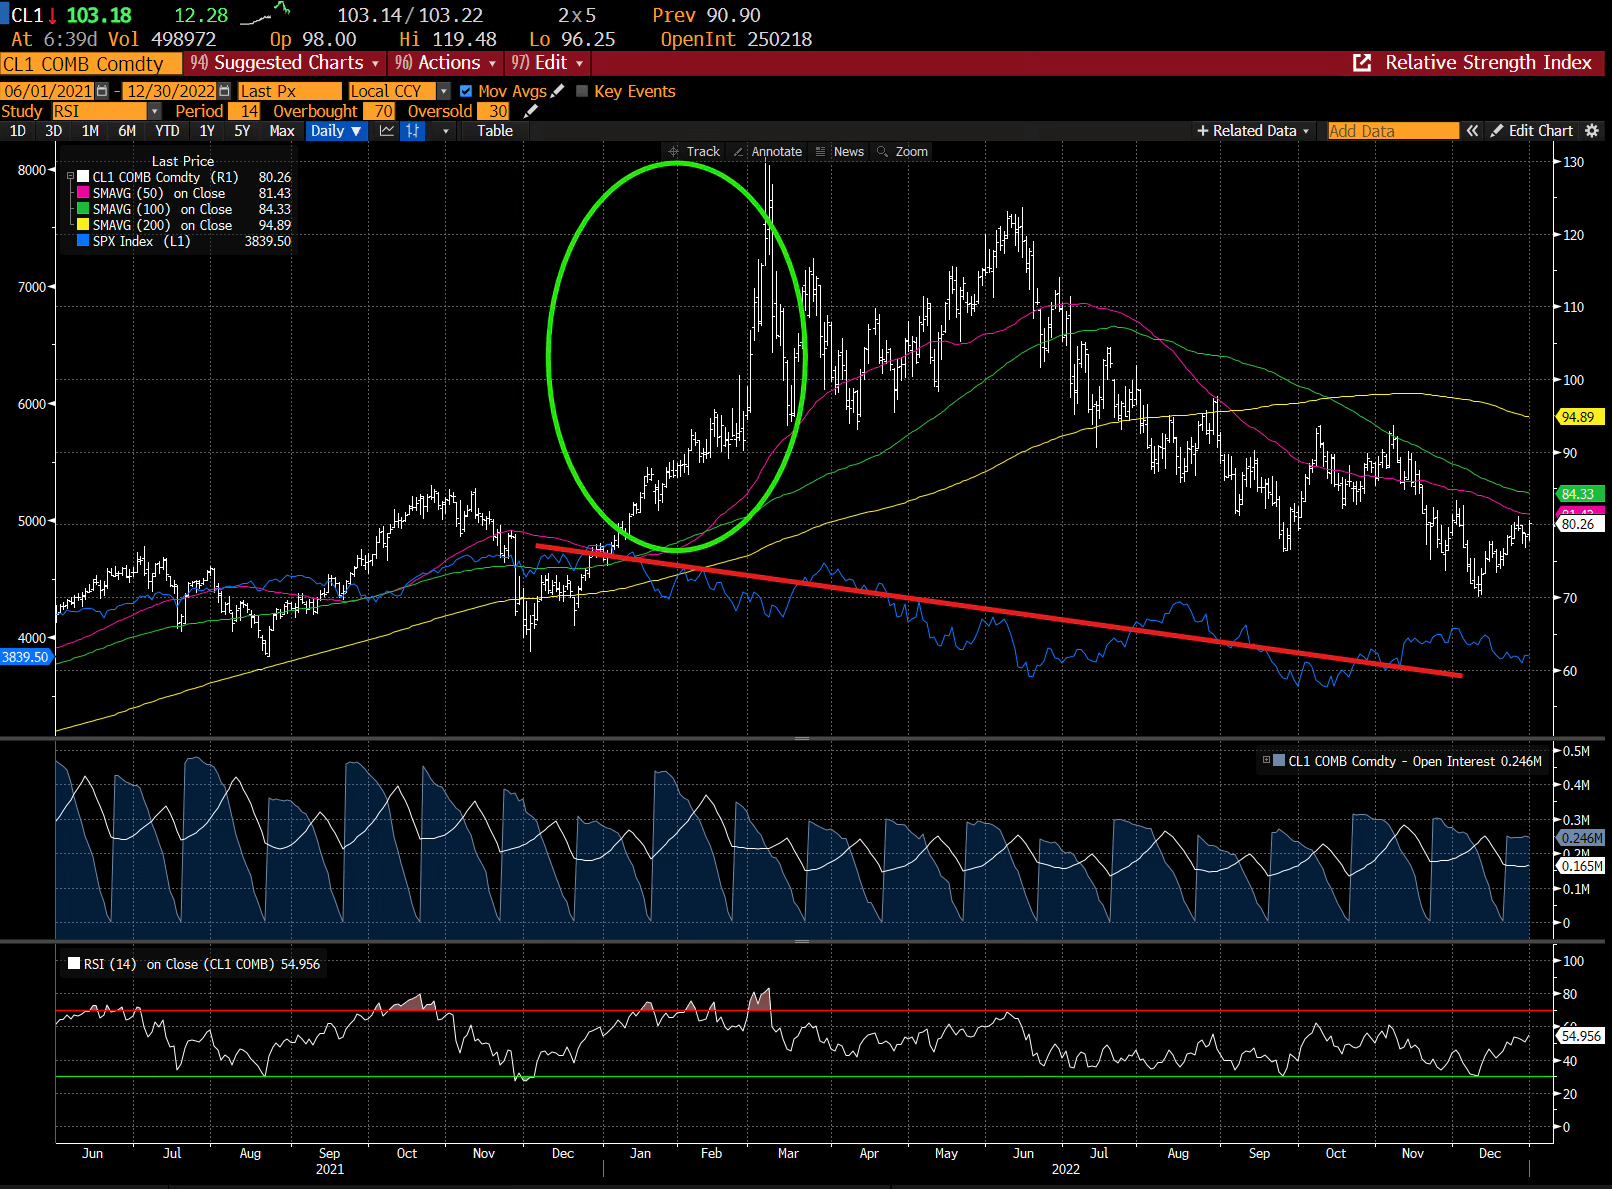
This one is similar to 1990, but with a more sustained rally after the initial rise.
After spiking in early March, oil traded in a volatile range and tested those highs again in June.
Similar to 1990, the stock market was also trading lower going into this unexpected event.
Now, here’s one final chart showing the price of oil heading into the recent spike.
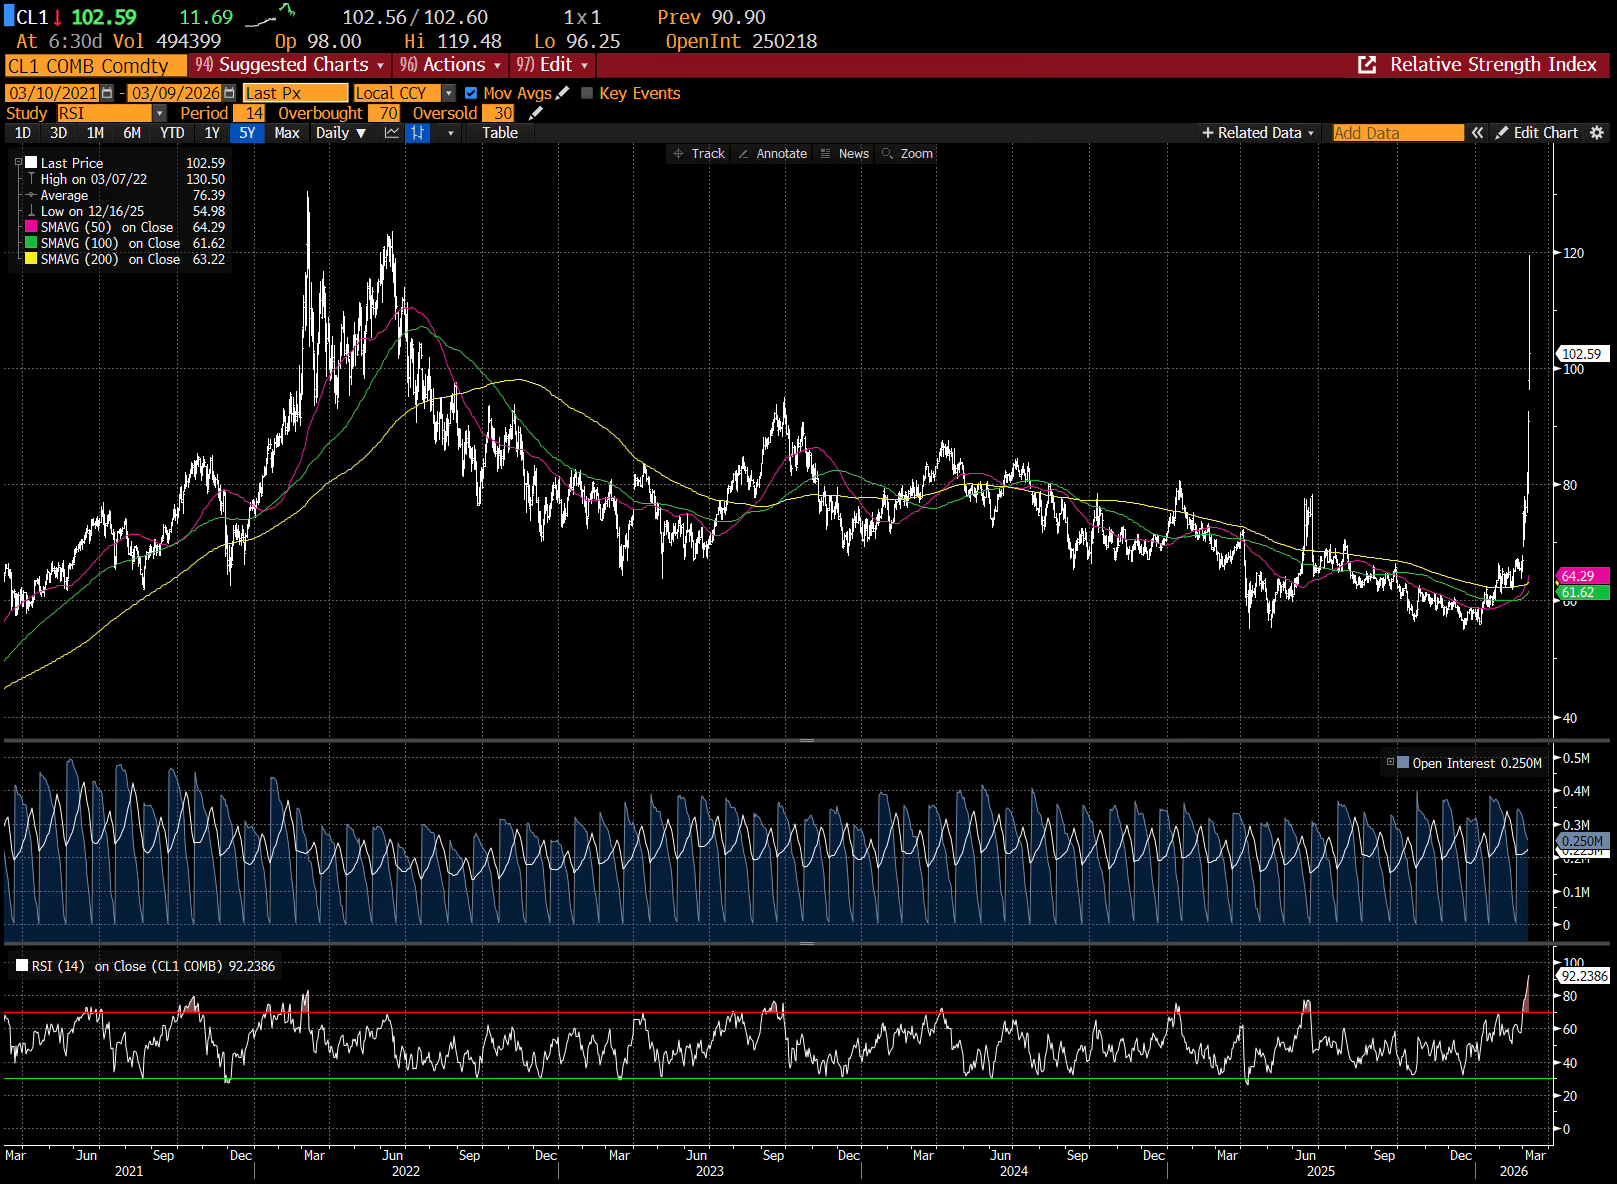
As you can see, oil prices peaked in June 2022 and have been trading lower ever since. As I mentioned above, they hit a new recent low just two months ago.
So where does this leave us with the current situation?
The Lesson Is Clear
My first conclusion is that oil prices are likely to remain somewhat elevated for a few months.
This time could be different if there’s mass destruction to oil production facilities in the region.
But I want to remind you that oil from the region makes up half of the global supply that it did 50 years ago.
For the stock market, I also think the direction of stocks going into the catalyst makes a difference.
While many stocks were consolidating for several months before the Iran conflict, the indices had all recently hit new highs.
So based on the historical parallels, the smart bet here is to buy stocks during the weakness after the spike in oil prices.
If you want to trade a little more aggressively, buying puts on oil futures is another excellent bet.
It’s a riskier approach than buying stocks, but big rewards almost always require some real risk.
Sign Up Today for Free!
Truth & Trends brings you market insights and trading tips you won't find anywhere else — unless you have your own personal hedge fund manager on speed dial...
Meet Enrique Abeyta, one of Wall Street’s most successful hedge fund managers. With years of experience managing billions of dollars and navigating the highs and lows of the financial markets, Enrique delivers unparalleled market insights straight to your inbox.
In Truth & Trends, Enrique shares his personal take on what’s moving the markets, revealing strategies that made him a star in the world of high finance. Whether it’s uncovering the next big trend or breaking down the hottest stocks and sectors, Enrique’s insights are sharp, actionable, and proven to work in any market condition.
Inside these daily updates, you’ll gain:
- 50 years of combined trading wisdom distilled into actionable insights.
- A behind-the-scenes look at how Wall Street pros spot opportunities and avoid pitfalls.
- Exclusive strategies that Enrique personally uses to deliver exceptional returns — no fluff, just results.
To have Truth & Trends sent directly to your inbox every weekday, just enter your email address below to join this exclusive community of informed traders.
Don’t miss your chance to learn from one of the best in the business.
Sign up now and take your trading game to the next level.

Fade the End of the World
Posted March 06, 2026
By Greg Guenthner

The Dark Side of the Tape
Posted March 04, 2026
By Nick Riso

The Iran War: What’s Next for Stocks, Oil and More
Posted March 02, 2026
By Enrique Abeyta

It’s Not Just You, This Market Is Mind-Melting
Posted February 27, 2026
By Greg Guenthner

Israel, India and Iran: The Calm Before the Strike
Posted February 26, 2026
By Enrique Abeyta
